Figure 2.
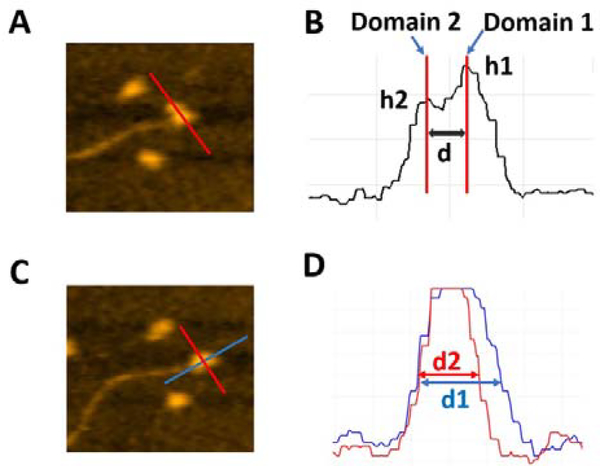
Schematics explaining the analysis of various types of complexes of A3G with DNA. A. AFM image of A3G-69 nt ssDNA complex. The red line shows the cross-section of dumbbell structure for the A3G-ssDNA complex. B. Cross-sectional measurements of the heights of domains (h1) and (h2) and the distance (d) between them. C. AFM image of the globular structure of the A3G-69 nt ssDNA complex. Red and blue lines show the orthogonal cross-sections of the A3G-ssDNA complex. D. Cross-sectional measurements of two orthogonal diameters, d1 and d2.

