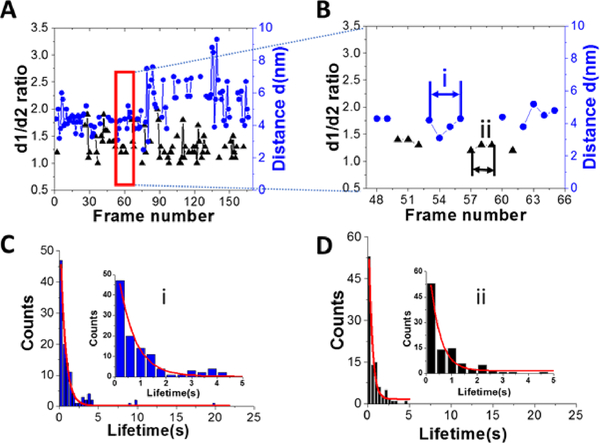
Figure 4.
Dynamics of A3G in complexes with 69 nt tail ssDNA. A. Plot illustrating the dynamics of A3G in complex with the 69 nt tail ssDNA. The blue dots represent the distance (d) between two domains for the dumbbell structure of A3G. Black triangles represent the ratio of two orthogonal diameters, d1:d2, for the globular structure of A3G. B. Zoomed view from Figure 4A (marked by red quadrant) for dumbbell (blue dots) and globular (black triangles) structures of A3G. The arrows show examples for calculation of the lifetime for dumbbell structures “i” (blue) and globular “ii” (black) for A3G. C. The histogram for the lifetime of A3G in the dumbbell structure, which after fitting with first-order exponential model, gives a lifetime of ~0.64 ± 0.03 seconds. D. The histogram for the lifetime of A3G in the globular structure, which after fitting with first-order exponential model gives a lifetime of ~0.39 ± 0.06 seconds. Insets are zoomed parts from frames C (i) and D (ii).

