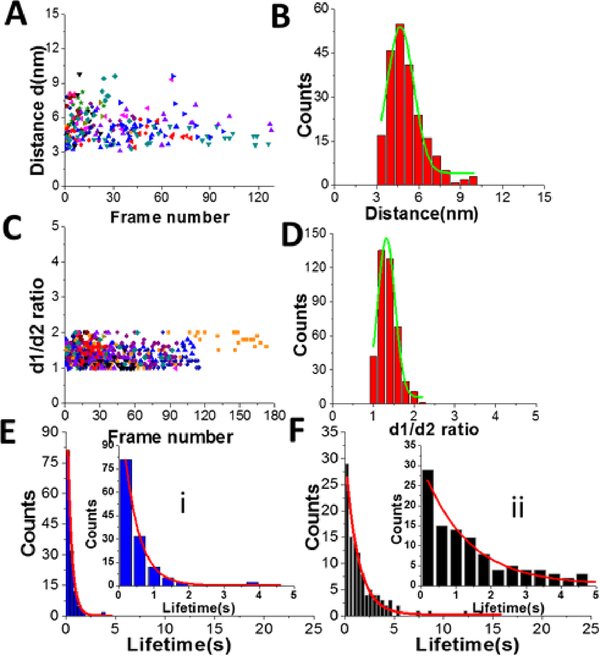
Figure 6.
Data analysis for the A3G-25 nt tail ssDNA complex. A. The distance (d) between Domain 1 and Domain 2 for the dumbbell structure of A3G in the A3G-25nt tail ssDNA complex. B. The histogram of the distances between two domains. The mean value for distances between Domain 1 and Domain 2 together with the standard deviation is 4.7 ± 1.0 nm. C. The dependence of d1:d2 ratio for the globular structure of A3G in A3G-25nt tail ssDNA complex on frame number. D. The histogram for the d1:d2 ratio. The mean value for d1:d2, with the standard deviation, is 1.3±0.2. E. The lifetime of dumbbell structure of A3G in complex with the 25 nt tail ssDNA. After fitting, the lifetime is 0.42 ± 0.01 sec. F. The lifetime of the globular structure of A3G in complex with 25 nt tail ssDNA. After fitting, the lifetime is 1.29 ± 0.09 sec. The data are the result of analysis of ~600 frames from 18 separate movies (molecules). Insets are zoomed parts from E (i) and F (ii).

