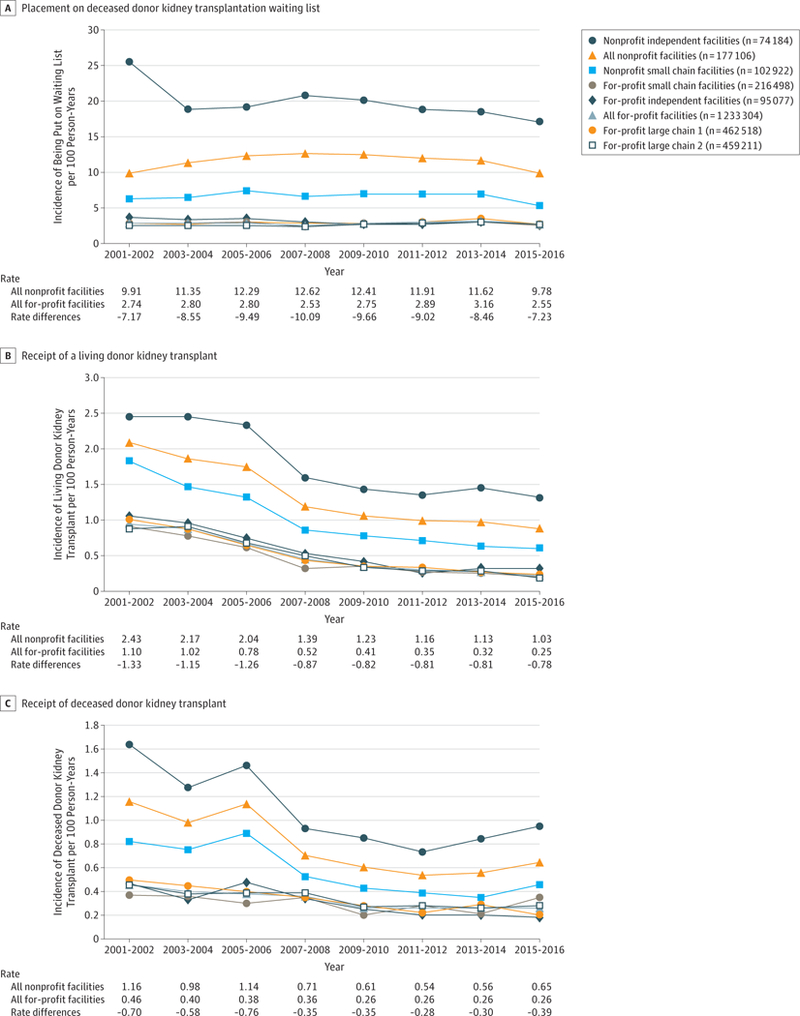
Figure 2. Two-Year Incidence Rates and Rate Differences for Kidney Transplant, 2001–2016.

Follow-up time was truncated on December31 ofeach2-yearperiod.Theunad-justed 2-year incidence rates (per100 person-years) for placement on the deceased donor waiting list, receipt of a living donor kidney transplant, and receipt of a deceased donor kidney transplant were calculated by dividing the count of events for incident patients by the number of incident patients in the dialysis facility ownership group for each interval. The 2-year incident rate differences (per100 person-years) were calculated between all nonprofit facilities and all for-profit facilities.
