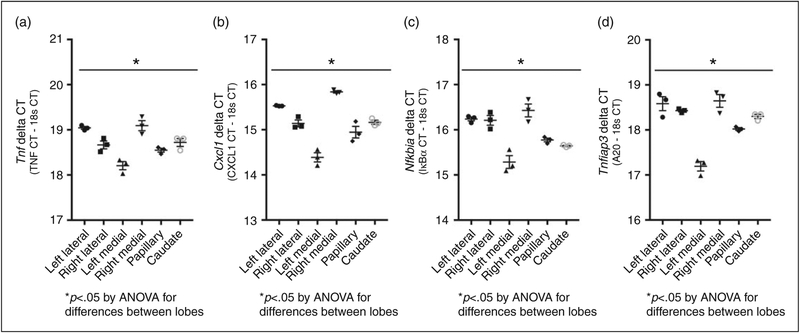
Figure 3.
LPS-induced primary response gene expression varies significantly by lobe while intra-lobe variance does not. CT values (CT of gene of interest minus CT of 18s) of (a) Tnf, (b) Cxcl1, (c) Nfkbia, and (d) Tnfaip3 from three separate samples taken from each lobe of a single adult male ICR mouse exposed to i.p. LPS challenge (5 mg/kg, 1–5 h). Each point represents a single value, error bars represent mean with SE. *P < 0.05 for differences between lobes by one-way ANOVA.

