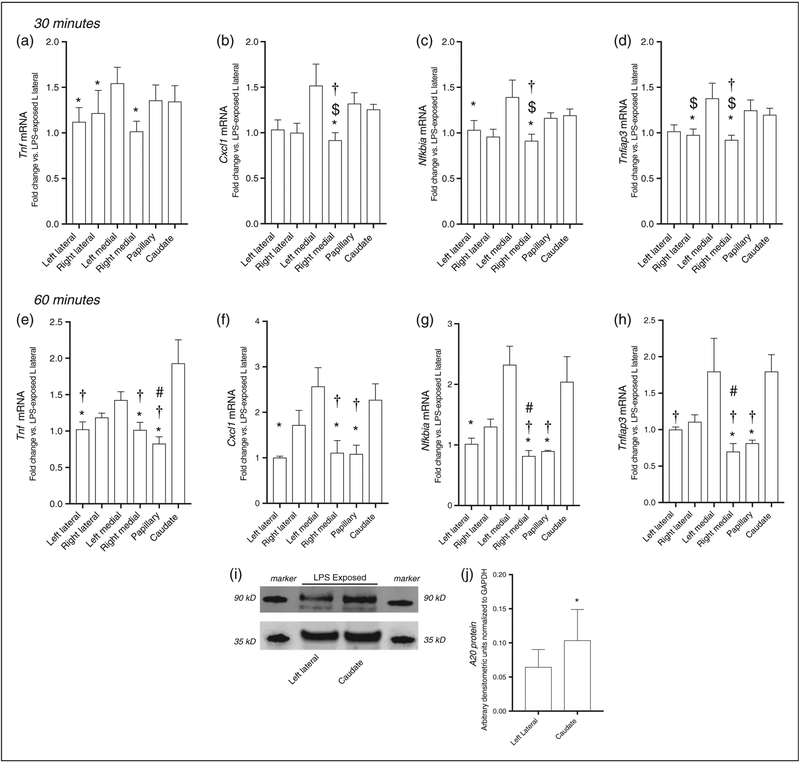
Figure 4.
LPS-induced primary response gene expression varies significantly by lobe at 30 and 60 min of exposure. LPS-induced fold change of primary response genes relative to left lateral lobe. Expression following 30 min of exposure of (a) Tnf, (b) Cxcl1, (c) Nfkbia, and (d) Tnfaip3 and following 60 min of exposure of (e) Tnf, (f) Cxcl1, (g) Nfkbia, and (h) Tnfaip3. Values are means SE (n 9/time point). *P < 0.05 vs. left medial lobe; †P < 0.05 vs. caudate process; $P < 0.05 vs. papillary process; #P < 0.05 vs. right lateral lobe; %P < 0.05 vs. left medial lobe; by Kruskal-Wallis test. (i) Representative Western blot showing LPS-induced A20 protein expression in the left lateral lobe and caudate process with GAPDH as loading control. (j) Densitometric analysis of A20 in hepatic lysate following LPS exposure. *P < 0.05 vs left lateral, by Wilcoxon matched-pairs signed rank test. Values shown as means ± SEM; n = 5–6/timepoint.

