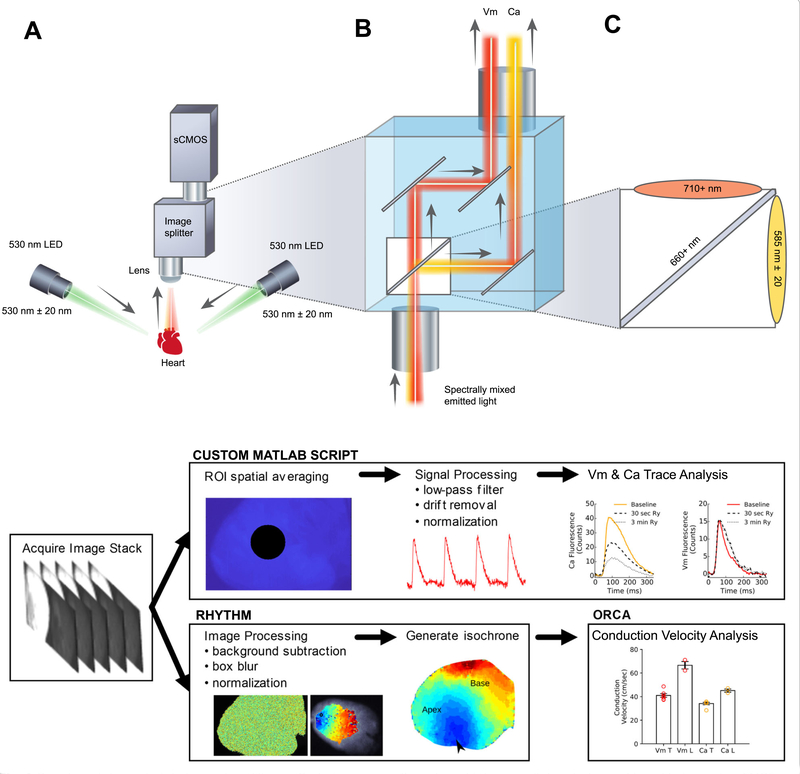
Fig. 1.
Overview of the optical design and workflow. a Optical system configuration with image splitting device positioned in front of a sCMOS camera (Zyla 4.2 PLUS, Andor Technologies), b Emission of each complementary probe (Vm, Ca) is separated by wavelength using an image splitting device (c) Dichroic cube setup with the two emission filters and a dichroic mirror. d Experimental workflow includes image acquisition, followed by signal processing using a custom MATLAB script or image processing in Rhythm [30] and conduction velocity analysis in ORCA [31]. Vm = transmembrane voltage, Ca = intracellular calcium signal

