Fig. 7.
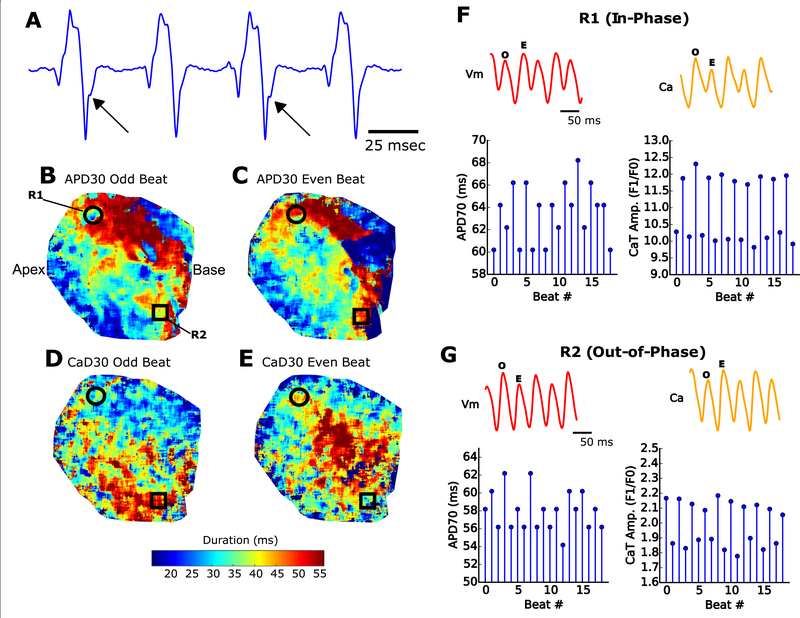
Simultaneous calcium and voltage imaging during ventricular tachycardia. a T-wave alternans (arrows) on alternating waveforms recording from an isolated, intact heart. b, c APD30 map shows repolarization heterogeneity during an odd “O” and even “E” beats. d, e CaD30 signals also show reuptake heterogeneity across the epicardial surface during odd and even beats. Optical action potentials and calcium transients display alternans that can be in-phase (f) or out-of-phase (g). In-phase alternans are represented by a small calcium transient amplitude following a shortened action potential duration. Out-of-phase alternans describe a tall calcium transient amplitude that follows a shortened action potential duration. APD30 = Action potential duration at 30% repolarization; CaD30 = Calcium transient duration at 30% relaxation; R1 & R2 = regions of interest; Vm = transmembrane voltage; Ca = intracellular calcium signal. Scale bar = 1 cm

