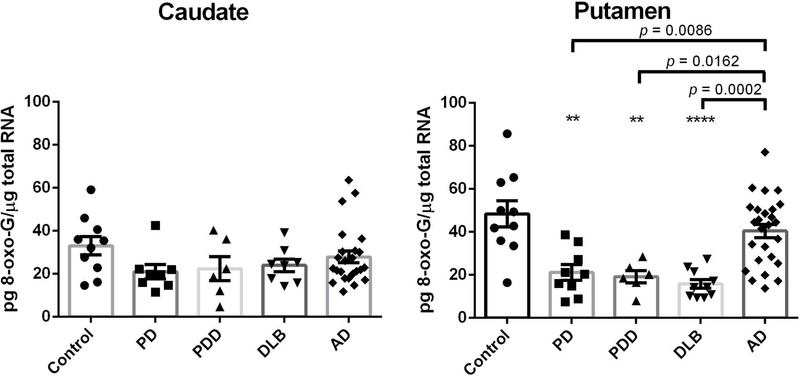
Figure 2.
8-oxo-G levels in the caudate and putamen from patients with diseases (PD: n=10, PDD: n=7, DLB: n=10, AD: n=26) and age-matched controls (n=10). Value shown are means ± SEM as the concentration of 8-oxo-G (pg) per total RNA (µg). A p value of <0.05 was considered significant: ** indicates p < 0.01, *** indicates p < 0.001, **** indicates p < 0.0001, vs. the controls. Significant differences between two non-control groups are indicated with brackets and corresponding p-values [Putamen: PD vs AD (p = 0.0086), PDD vs AD (p = 0.0162), DLB vs AD (p = 0.002)].

