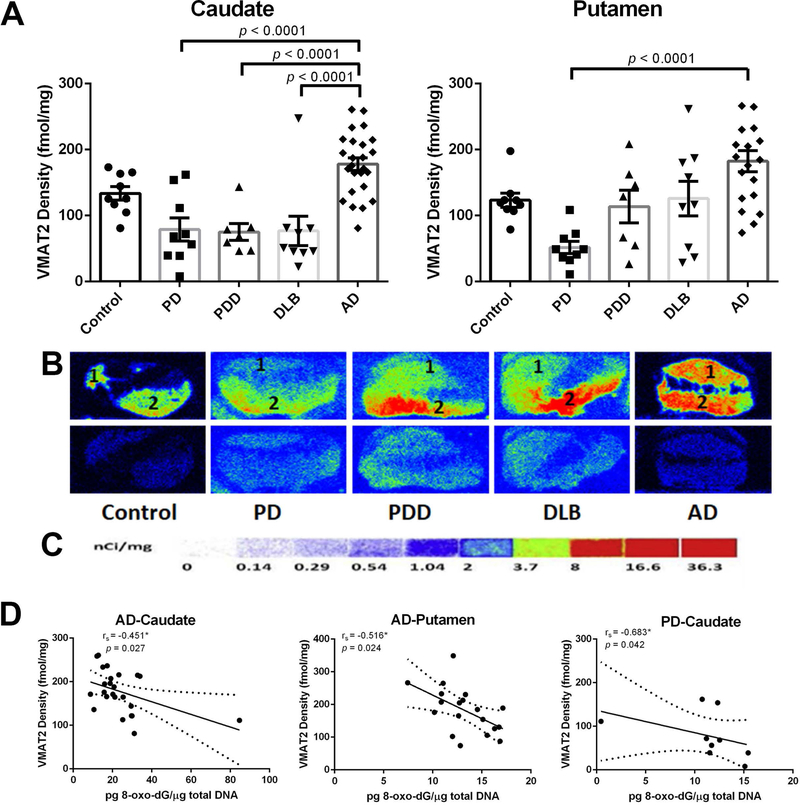
Figure 4.
Quantitative autoradiographic analysis of VMAT2 density in the caudate and putamen from patients with diseases (PD: n=10, PDD: n=7, DLB: n=10, AD: n=26) and age-matched controls (n=10). A: Quantitative analysis of the VMAT2 density (fmol/mg) in the caudate and putamen from subjects. Value shown are means ± SEM. Statistical significances between two disease groups are indicated with brackets and corresponding p-values (p < 0.0001 were found for PD vs AD, PDD vs AD, and DLB vs AD in the caudate, as well as PD vs AD in the putamen). B: Autoradiograms show total binding of 4 nmol/L [3H]DTBZ (Panel B top row) and nonspecific binding in the presence of 1 µM S(−)-tetrabenazine (Panel B bottom row) in the striatal regions of 5 representative subjects. The numbers 1 and 2 designate the following regions: caudate (1) and putamen (2). C: [3H]Microscale standards (ranging from 0 to 36.3 nCi/mg) were also counted. D: Density of VMAT2 as concentration of 8-oxo-dG in the caudate and putamen from AD brains (p = 0.027 and p = 0.024, respectively), as well as that in the caudate from PD brains (p = 0.042). rs, the Spearman’s rank correlation coefficient.

