Figure 5.
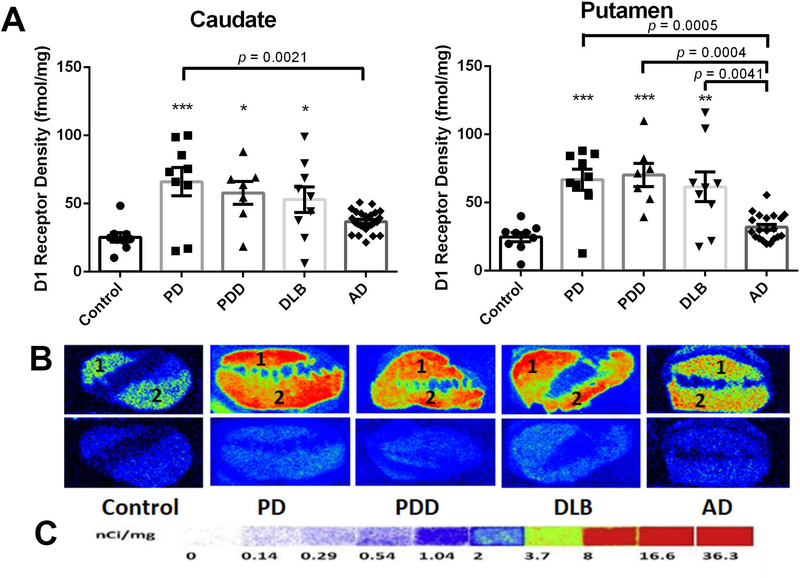
Quantitative autoradiographic analysis of D1R density in the caudate and putamen of patients with diseases (PD: n=10, PDD: n=7, DLB: n=10, AD: n=26) and age-matched controls (n=10). A: Quantitative analysis of the D1R density (fmol/mg) in the caudate and putamen of subjects. Value shown are means ± SEM. Statistical significances between two disease groups are indicated with brackets and corresponding p-values [Caudate: PD vs AD (p = 0.0021); Putamen: PD vs AD (p = 0.0005), PDD vs AD (p = 0.0004), DLB vs AD (p = 0.0041)]. A p value of < 0.05 was considered significant: ** indicates p < 0.01, *** indicates p < 0.001, vs. the controls. B: Autoradiograms show total binding of 1.5 nM [3H]SCH23390 (Panel B top row) and nonspecific binding in the presence of 1 µM (+) butaclamol (Panel B bottom row) in the striatal regions of the same 5 representative subjects. The numbers 1 and 2 designate the following regions: caudate (1) and putamen (2). C: [3H]Microscale standards (ranging from 0 to 36.3 nCi/mg) were also counted.

