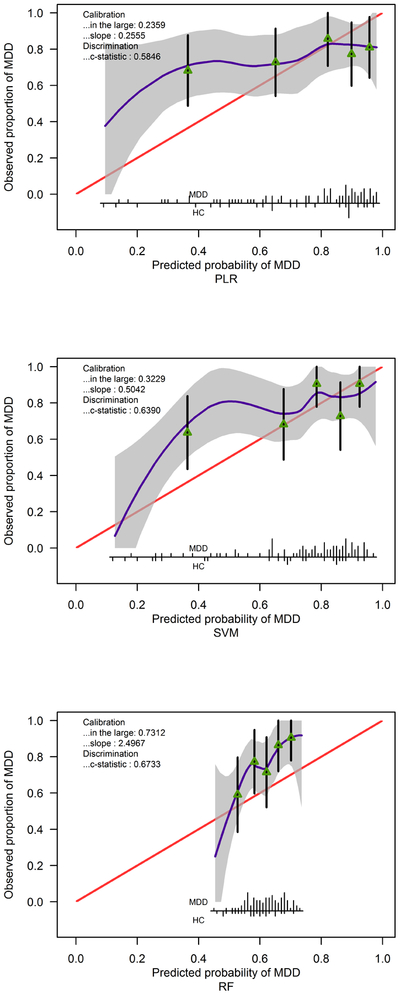
Figure 3:
Calibration plot for predicting diagnosis based on three methods and 39 features. Calibration in the large quantifies the difference between mean predicted probability of having Major Depressive Disorder (MDD) and observed proportion of MDD patients. The closer to 0, the better the calibration is. The calibration slope different from 1 suggests that the overall predictive performance of 39 features was different from that observed in the validation data. A calibration slope less than 1 reflects an overestimation of MDD risk, and vice versa for a calibration slope greater than 1 (Van Calster et al., 2016). The c-statistic is identical to the AUC values and its confidence intervals are in Table 10. Spikes at the bottom of the graph indicate the probability distribution for those with MDD and Healthy Controls (HC). Triangles indicate quintiles of subjects according to predicted probability with 95% confidence intervals for the observed proportions of patients with MDD. For example, the fact that for PLR and SVM, the spikes mostly appear near 0.9, and the triangles are near the right hand side, is consistent with the calibration slope less than 1, i.e., overestimating MDD risk.

