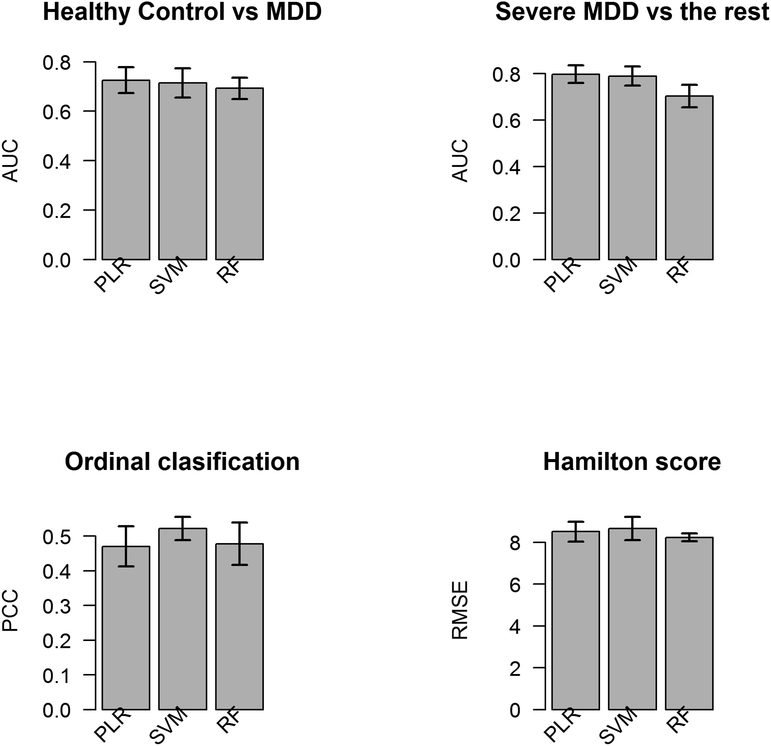
Figure A1:
Bar plot for the 5-fold cross-validated performances for each task. MDD: Major Depressive Disorder; PLR: penalized logistic regression model with elastic net penalty, SVM: support vector machine, RF: random forest; AUC: area under the curve; PCC: percentage correctly classified; RMSE: root mean squared error

