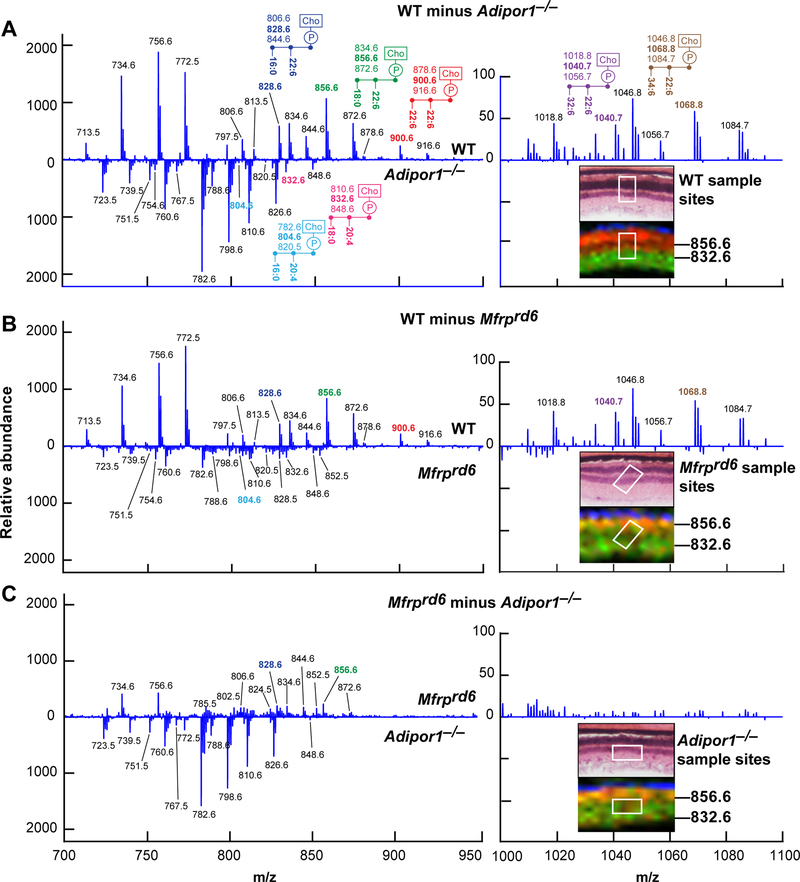
Fig. 3.
Differential MALDI spectra reveal compensatory PCs generated in Adipor1−/− and the Mfrprd6 retina. Difference spectra show relative abundances detected by MALDI IMS. (A) Molecules more abundant in WT retina vs Adipor1−/− retina are presented in the upper part of the graph, while molecules more abundant in the Adipor1−/− retina are displayed at the bottom. 22:6- and/or VLC-PUFA-containing PCs are much more abundant in WT while 20:4-containing PCs are increased in the mutant retina. The regions from which the spectra are extracted are shown in the insert Fig. 5H,E (top) and MALDI (bottom), showing PC40:6 (m/z = 856.6, red) and PC38:4 (m/z = 832.6, green). The identification of the mass numbers are shown in Supplemental Table 3. (B) The difference spectra of Mfrprd6 to WT. (C) The difference spectra of Adipor1−/− to Mfrprd6. Inset images show that in both mutants, the PRC layers contain both PCs 40:6 and 38:4 (yellow) while WT has clear separation of the two PCs species between PRC layer and inner retina layer.

