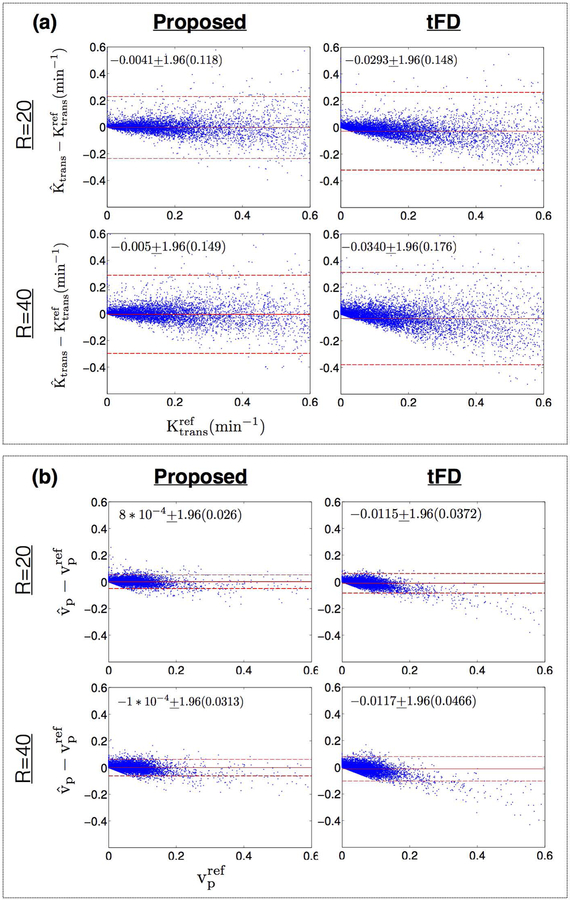
Figure 10:
Bland-Altman plots of a) the difference between estimated Ktrans (at R=20, R=40) and reference Ktrans; b) the difference between estimated vp (at R=20, R=40) and reference vp; for the proposed (left column) and tFD (right column) reconstructions. Each dot corresponds to one pixel within the tumor ROIs of all the 12 cases. The mean and 1.96 times the standard deviation (μ±1.96σ) of the difference entities are quantitatively shown. These are also qualitatively marked by the solid red and dotted red lines. As seen from the plots, the proposed approach had lower bias (μ) and uncertainty (σ) in estimating Ktrans, and vp in comparison to tFD. tFD depicted a systematic bias in under-estimating Ktrans, and vp in comparison to the proposed approach This can also be noted from the qualitative comparisons in Fig. 9.

