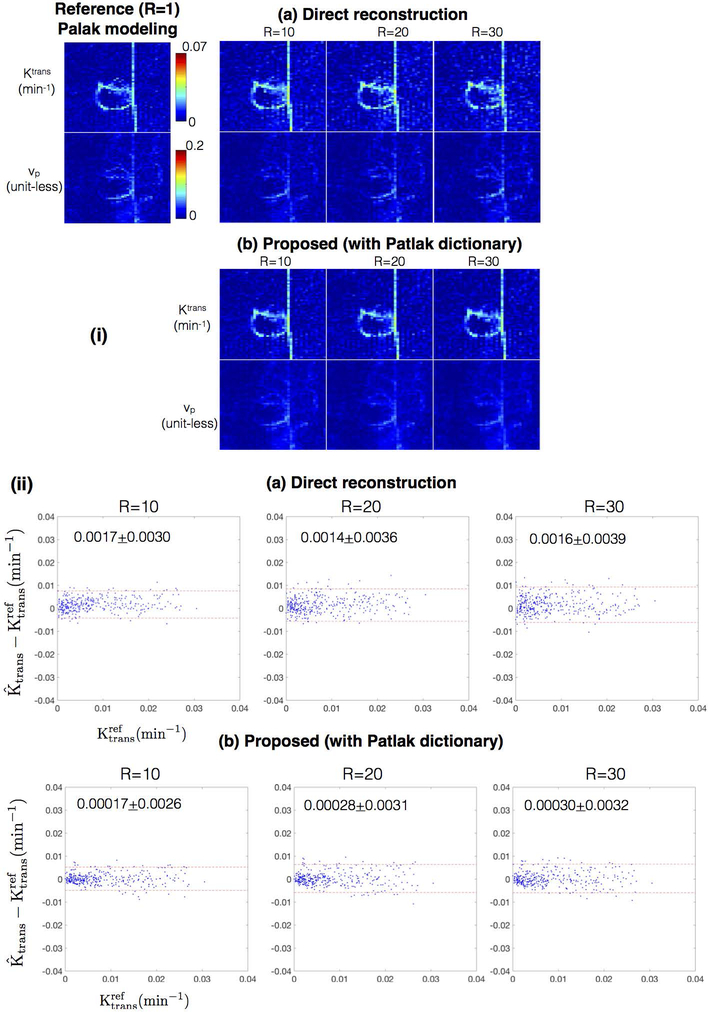
Figure 11:
(i) Comparison of Ktrans and vp derived from the methods of direct reconstruction of Patlak parameters36, and the proposed approach with a Patlak dictionary at R=10, 20, 30 against the reference fully sampled reconstruction followed by Patlak modeling (R=1). (ii) shows the Bland-Altman plots of the difference between estimated Ktrans (at R=10, 20, 30) and the reference Ktrans for the direct reconstruction and proposed reconstruction with the Patlak dictionary. Each dot corresponds to one pixel within the tumor ROI of case 7 as marked in Figure 2. The mean and 1.96 times the standard deviation (μ±1.96σ) of the difference entities are quantitatively shown in (ii). Both direct reconstruction, and the proposed dictionary reconstruction provides good spatial fidelity in the reconstructed maps (in i). From the Bland Altman plots in (ii), the proposed approach demonstrated subtle improvements over the direct reconstruction in terms of a smaller bias and reduced noise amplification.

