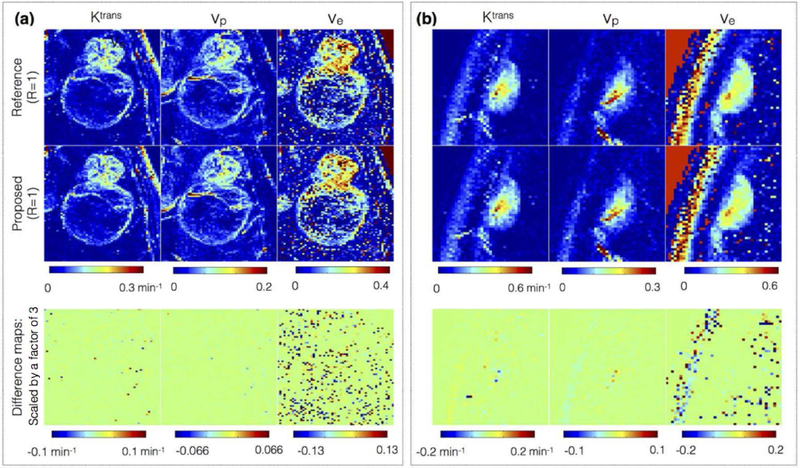
Figure 7:
Comparison of kinetic parameters obtained from concentration time profiles from reference fully sampled data (first row) against the profiles after 3-sparse projections onto the ETK dictionary (second row). The third row denotes the difference map that highlight the kinetic modeling errors. The difference map is scaled up by a factor of 3 for better visualization. Two representative brain tumor datasets that have different spatial characteristics are shown: (a) glioblastoma with thin rim, necrotic core, connected to a solid tumor; (b) meningioma with homogenous spatial tumor characteristics. The kinetic maps in the first two rows are observed to be qualitatively equivalent suggesting 3-sparse projection mimics ETK modeling. Compared to the Ktrans, and vp maps, the uncertainty in ve is large attributed to the short scan time duration of 5 minutes.

