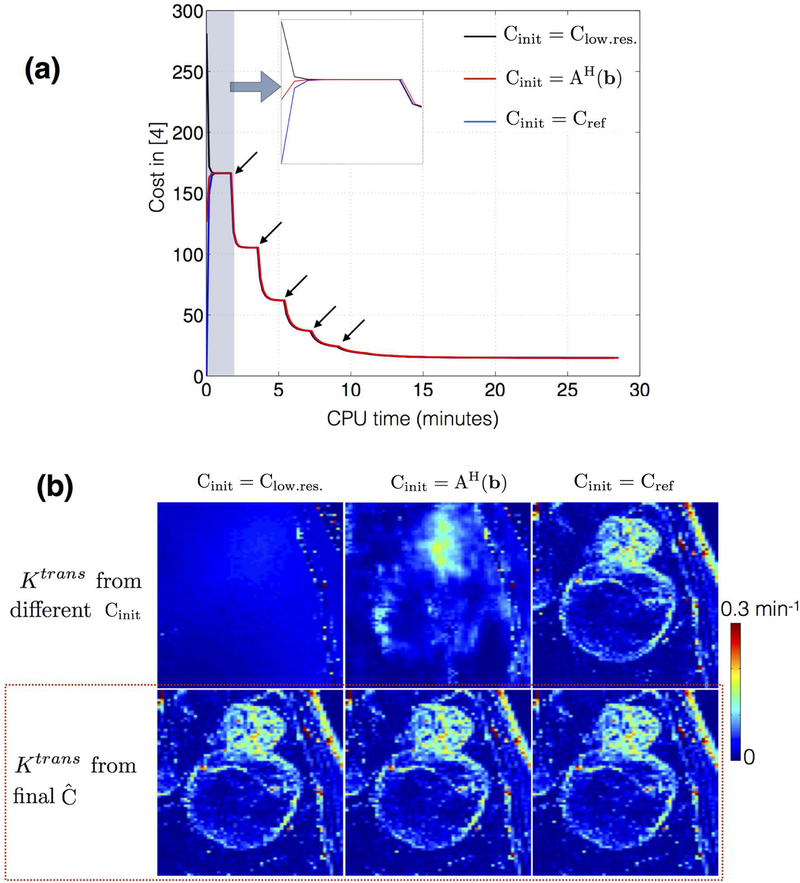
Figure 8:
Convergence of cost function in [3]: (a) shows the evolution of cost with different initializations of the concentration time profiles (C). (b) demonstrates the Ktrans estimated from the initial guesses (top row), and from the final estimated concentration time profiles (bottom row). Due to the iterative multi-scale optimization, the algorithm ensures cycling through problems of increasing complexity. The black arrows in (a) indicate the instances at which the scale (spatial resolution) is incremented. It can be seen in (a) that the cost converges to the same minima irrespective of the initializations. The final estimated Ktrans in (b) from the different initializations are identical (see red dotted box).

