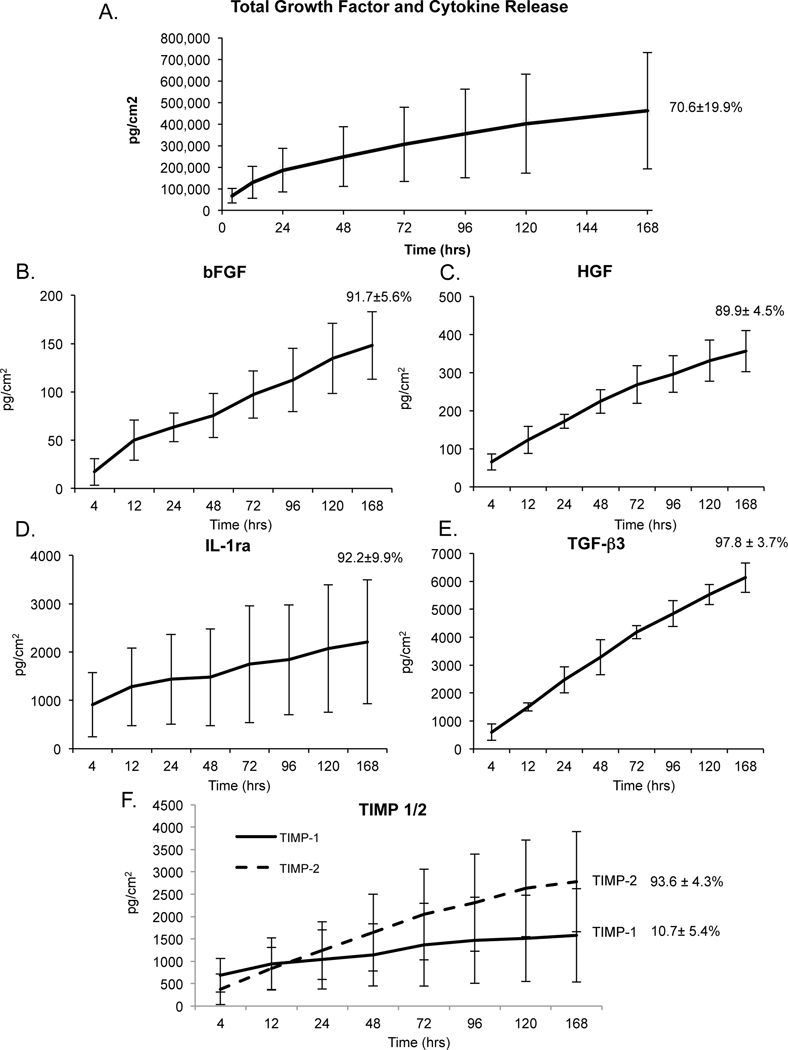
Figure 2.
Release of growth factors from HSAM: a) cumulative release curve for all 25 growth factors listed in Table 1, b) basic fibroblast growth factor (bFGF), c) hepatocyte growth factor (HGF), d) interleukin1 receptor antagonist (IL-1ra), e) transforming growth factor beta 3 (TGF-β3), and f) tissue inhibitor of metalloproteinase 1 & 2 (TIMP-1/2). Cytokine concentrations are shown as average ± standard deviation for all time points, and total % average ± standard deviation released at 7 days is inset for all release curves (n=3).

