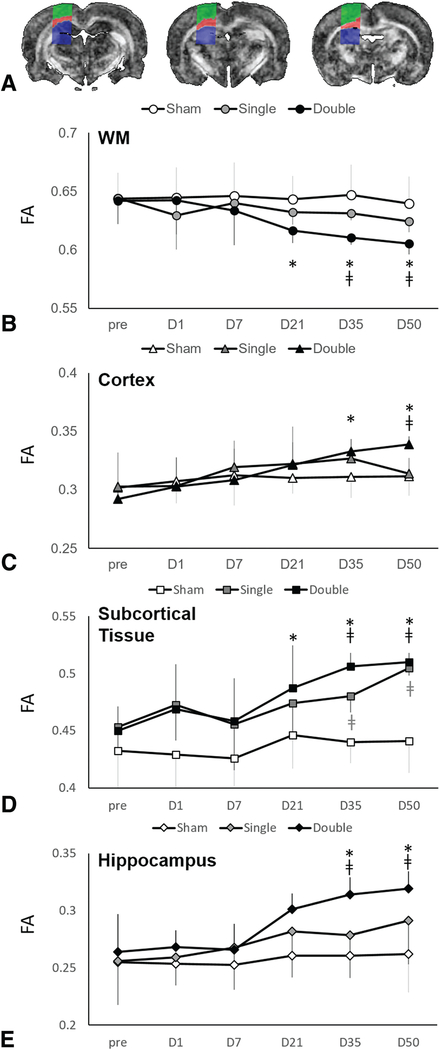
FIG 1.
Longitudinal changes in FA after CHI. A, Automatically segmented ROIs deep to the site of impact on 3 consecutive slices show the cortex (green), white matter (red), and subcortical tissue (blue). Longitudinal follow-up during the first 50 days shows the evolution of mean FA values across time, which differ between white matter (B) and gray matter (C–E) structures, as well as important differences between single and double injury. Data are means; ‡ indicates P <.05 versus the sham; asterisk, P <.05 versus baseline (day 0 [D0]).

