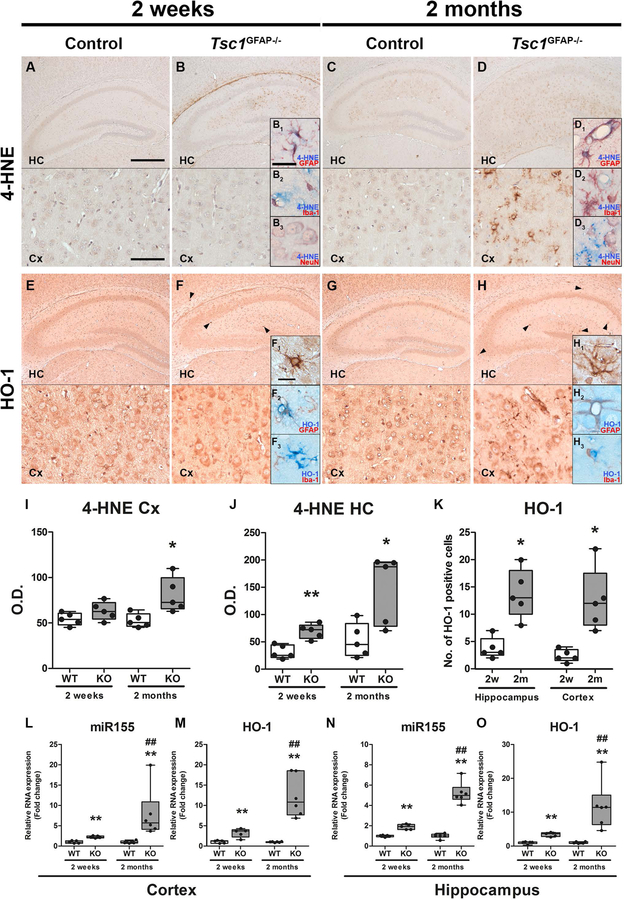
Fig. 3. Higher expression of 4-HNE, HO-1 and miR155 in Tsc1GFAP−/− mice precedes the development of seizures.
(A, B) Expression of 4-HNE in the hippocampus (HC) and cortex (Cx) of 2-week-old control mice was low while it was detectable in 2-week-old Tsc1GFAP−/− mice before seizure onset, however, only in the hippocampus mainly perivascular and in GFAP and occasionally NeuN expressing cells, but not Iba-1 positive cells (B1–B3). (C, D) 4-HNE expression was higher in the hippocampus of 2-month-old control mice after seizure onset compared to 2-week old control mice before seizure onset. Two-month-old Tsc1GFAP−/− mice with recurrent seizures displayed high 4-HNE expression in the hippocampus and cortex with similar perivascular expression and co-localization with GFAP positive cells as in 2-week-old mice (D1–D3). (E, G) HO-1 was moderately expressed in the hippocampus and cortex of 2-week-old and 2-month-old control mice. (F) In contrast, 2-week-old Tsc1GFAP−/− mice showed very high expression in sparsely distributed GFAP-positive cells mainly in the hippocampus before seizure onset (arrowheads, F1). Iba-1 positive cells were in close proximity to the HO-1 expressing cells, but did not show co-localization (F2,3). (H) In 2-month-old Tsc1GFAP−/− mice with recurrent seizures the number of cells displaying strong HO-1 expression was higher than in animals before seizure onset and could also be found in the cortex. (I–J) Quantification of 4-HNE OD revealed higher 4-HNE reactivity in two-week-old animals in the HC and in HC and Cx in two-month-old mice. (K) Additionally, the count of cells with strong HO-1 expression increased in the HC and Cx in 2-month-old mice after seizure development (F1, H1). (L–O) RNA quantification of miR155 and HO-1 in the hippocampus and cortex revealed higher expression in Tsc1GFAP−/− mice already before seizure onset compared to control, which was even higher in mice after the development of recurrent seizures. Scale bars: 500 µm (hippocampus) and 100 µm (cortex) in A, 50µm in B1 (representative of B1–B3, D1–D3) and 20 µm in insert in F1 (representative of F1–F3, H1–H3)). Mann-Whitney U-test. Data are expressed relative to expression observed in WT for the respective age group and presented as individual data points as well as in box plots. Error bars represent range; * p<0.05, ** p<0.01 (L–O ## p<0.01 2-week-old vs. 2-month-old Tsc1GFAP−/− mice). n = 5 animals per group

