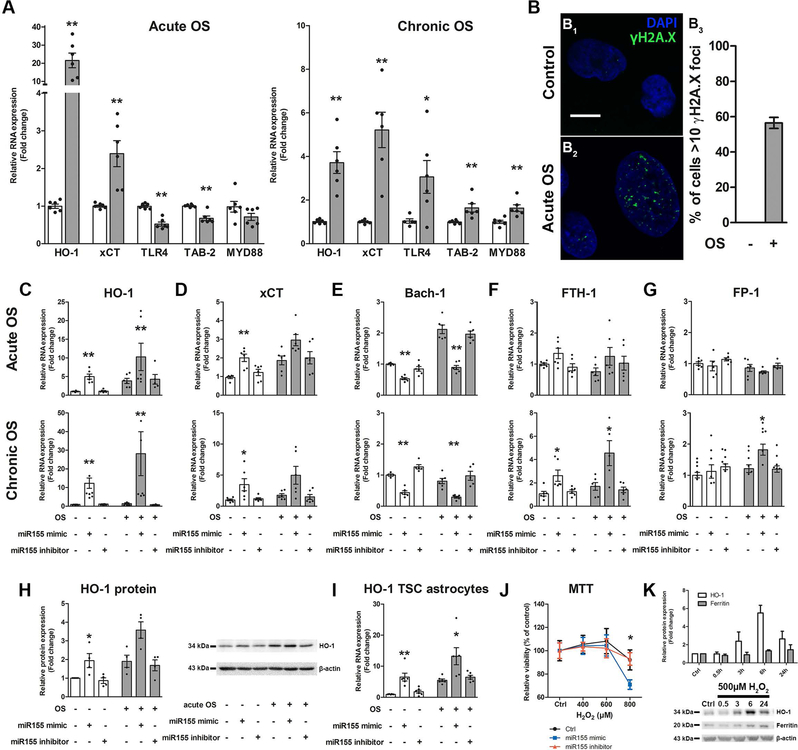
Fig. 4. In vitro, human fetal astrocytes displayed different response to acute vs. chronic OS and chronic HO-1 expression can induce genes involved in iron regulation.
(A) Acute OS rapidly induced gene expression of Nrf-2 targets HO-1 and xCT, while NF-κB signalling genes TLR-4 and TAB-2 were downregulated. Chronic OS increased expression of HO-1 and xCT. However, the HO-1 increase was lower than after acute OS. Moreover, in contrast to acute OS TLR-4, TAB-2 and MYD88 expression was increased. (B) Exposure to acute OS induced rapid expression of γH2A.X in the nucleus of human foetal astrocytes compared to control (B2). Quantification of cells displaying >10 γH2A.X foci could not be detected in control cells, while acute OS induced expression in approx. 55% of cells (B3). (C, D, H, I) Transfection of fetal astrocytes with miR155 mimic induced expression of HO-1 and xCT even in the absence of OS. This effect was preserved in cells derived from TSC patients and could be reversed by the inhibitor of miR155. (E) Additionally, Bach-1 expression was lower. These effects were independent of the presence of acute (3 h) or chronic (72 h) OS. (F, G) Transfection of fetal astrocytes with miR155 mimic for 24 h followed by acute OS had no effect on expression of FTH-1 and FPN-1. In contrast, prolonged exposure to the miR155 mimic for 72h coupled to chronic OS induced FTH-1 and FPN-1. (J) Moreover, fetal astrocytes exposed to miR155 mimic for 72 h displayed increased susceptibility to high H2O2 concentrations compared to control and miR155 inhibitor transfected cells as measured using the MTT assay. (K) Fetal astrocytes stimulated with H2O2 for different time points displayed rapid expression of HO-1 protein which peaked at 6 h and decreased again after 24 h. In parallel, ferritin expression increased with a delay and remained high even after 24 h. Scale bar is 10 µm in B. Mann-Whitney U-test in A, J. Kruskal-Wallis test followed by Dunn’s in C–I, K. Data are expressed relative to expression observed in control groups and the mean value as well as the individual data points are shown. Error bars represent SEM; *p<0.05, ** p<0.01, n = 3 independent cultures in duplicates (n = 379 cells (control) and 442 cells (acute OS) in B3; 3 single cultures for H, I, K; 3 independent cultures in quadruplicates for J) per experiment

