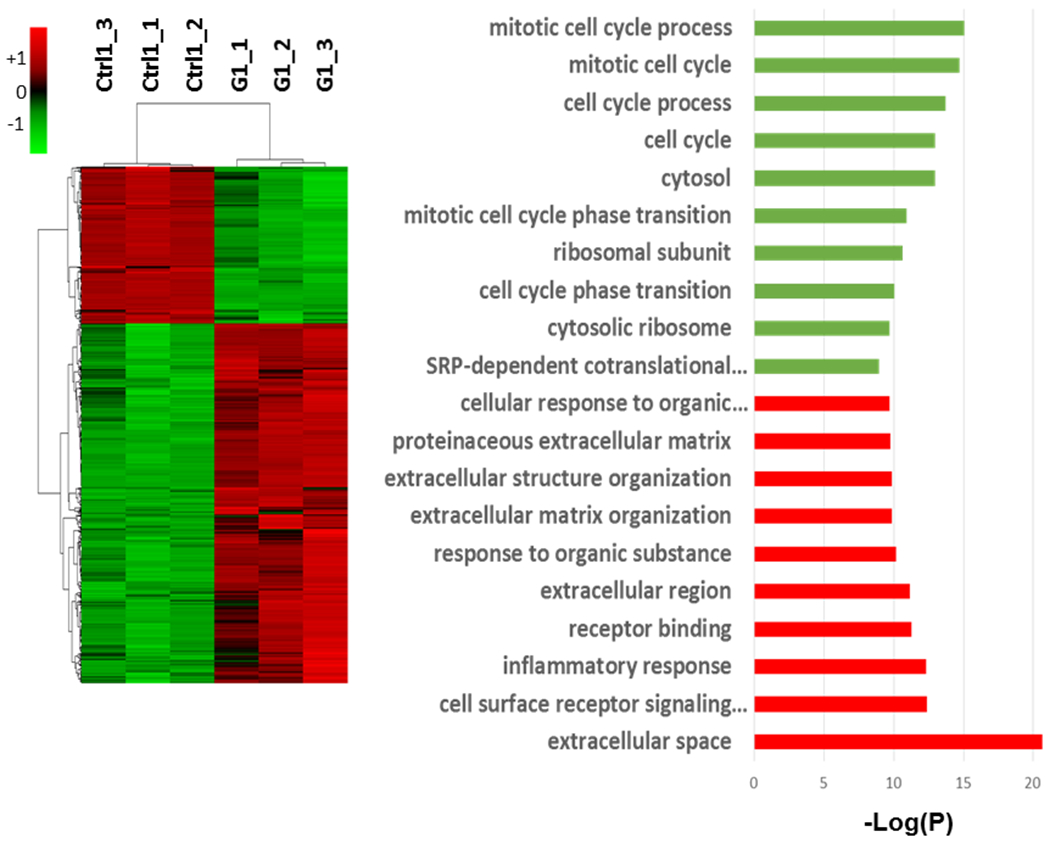
Figure 3.

Global transcriptional changes in response to sub-cytotoxic TiO2 NP exposure. Gene expression profiling of Generation 1 (G1) cells following 24 hrs of TiO2 NP exposure. Hierarchical clustering (left) and gene ontology (right) analyses of differentially expressed genes (DEGs) that had expression changes greater than 2-fold (p<0.05, n=3) are shown. Among the DEGs at Generation 1, 1,547 were upregulated and 676 genes were downregulated.
