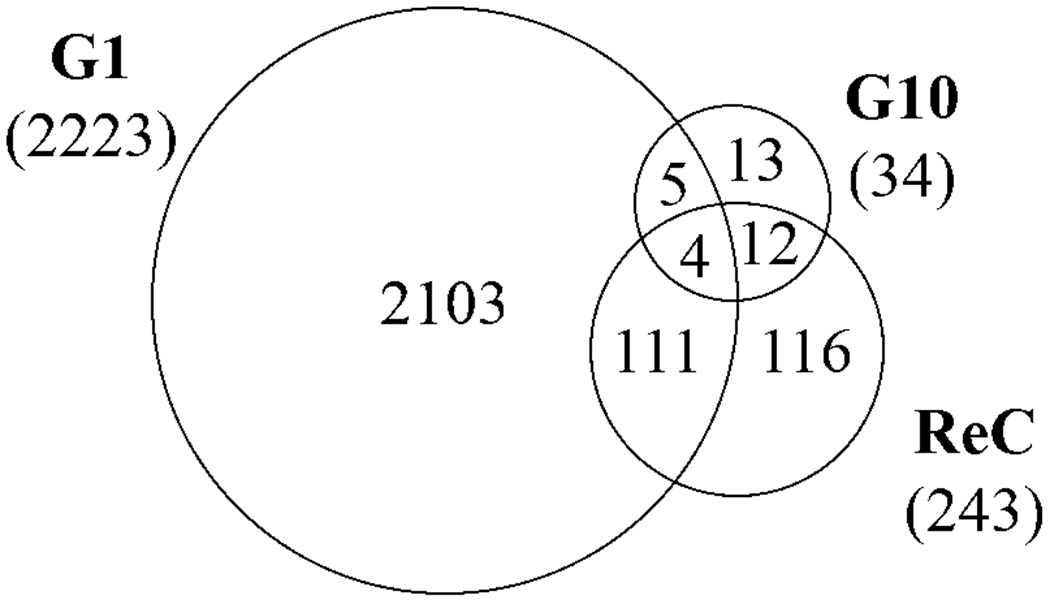
Figure 5.

Venn diagram showing overlap of differentially expressed genes (DEG, >2-fold change, p<0.05, n=3) at G1, G10, and following the re-challenge at G10 (ReC). Each generation of cells is normalized against untreated controls (n=3) at the same passage number to account for passage-dependent changes. The numbers in parentheses show the total number of DEGs for each generation.
