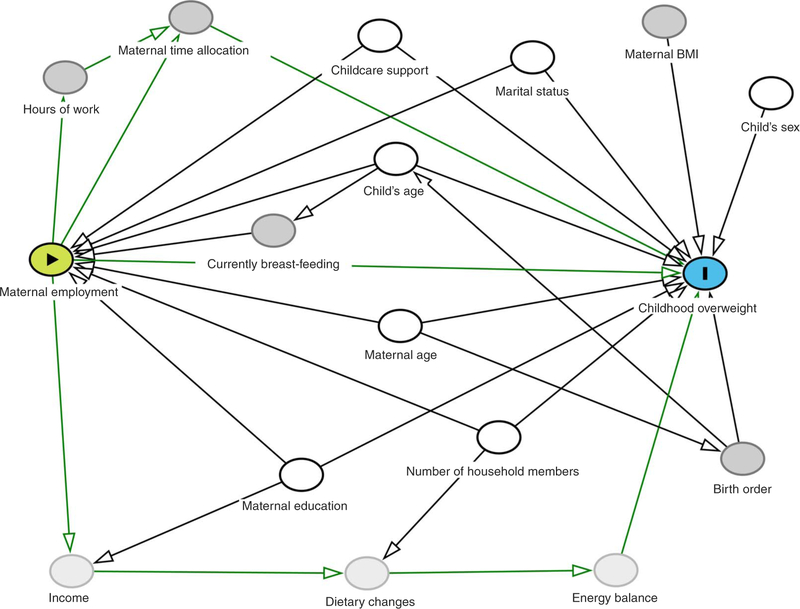
Fig. 1.
Directed acyclic graph for the association between maternal employment and childhood overweight:  , exposure;
  , outcome;
  , adjusted variable;
  , unobserved (latent) variable;
  , other variable;
  , causal path. Birth order was highly collinear with child’s age. Therefore, we controlled for child’s age in our primary models.

