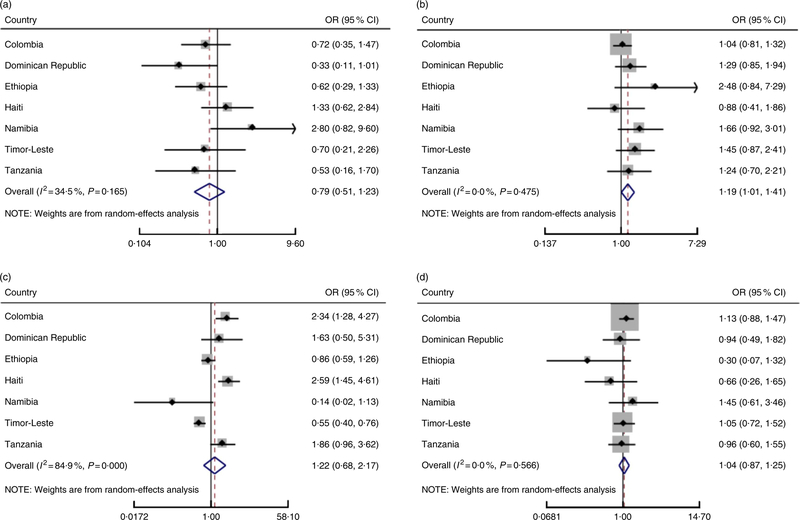
Fig. 3.
Forest plots showing the relationship between maternal employment and childhood overweight in seven low- and middle-income countries where the association varied by maternal education (a, formal employment, low education; b, formal employment, high education; c, informal employment, low education; d, informal employment, high education). The study-specific OR and 95 % Ci are represented by the black diamond and horizontal line, respectively; the area of the grey square is proportional to the specific-study weight to the overall meta-analysis. The centre of the open diamond and the vertical dashed line represent the pooled OR; the width of the open diamond represent represents the pooled 95% CI. Country-specific OR are estimated using logistic regression. Pooled OR ratios are generated using meta-analysis and pool estimates across countries. Childhood overweight is defined as BMI Z-score > 2 based on the 2006 WHO Child Growth Standards(33). Models were adjusted for maternal age (years), marital status (married, not married), number of household members, child’s age (months), child’s sex and substitute childcare provider (yes, no). Models include an employment × education interaction term (less primary education, at least primary education completed)

