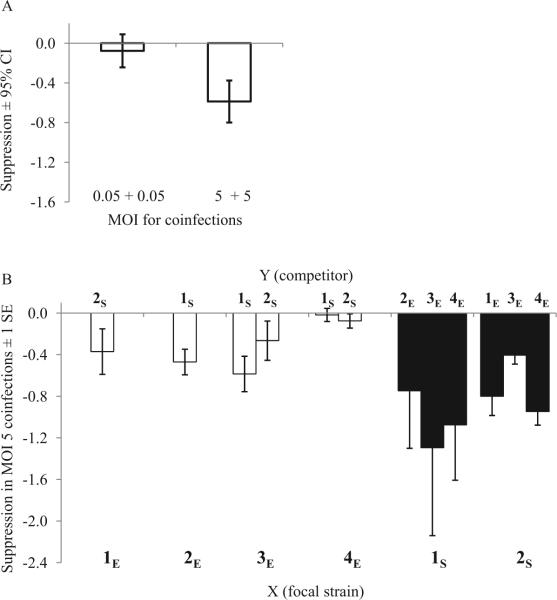
FIG. 2.
Effects of competitor density and ecotype on suppression in coinfections. Suppression of strain X is: log10 pfu/mL of strain X in single-strain infections minus log10 pfu/mL of strain χ in mixed-strain infections with competitor Y (indicated on Y-axis, see Materials and Methods). Zero indicates that titers in mixed infections are similar to those in single infections (no suppression), whereas negative values indicate suppression. (A) Columns are the mean suppression over all mixed-strain coinfections in each MOI treatment. Error bars are 95% confidence intervals (CI) from the t-test: suppression of χ at MOI 0.05 versus 5. (B) Mean suppression ± SE of the four replicate infections conducted for each pair of strains for mixed-strain coinfections at MOI 5. Columns for each strain are color-coded by ecotype: endemic (white) and sylvatic (black). Experimental strains (χ) are indicated above competitors (Y).

