
Figure 3.
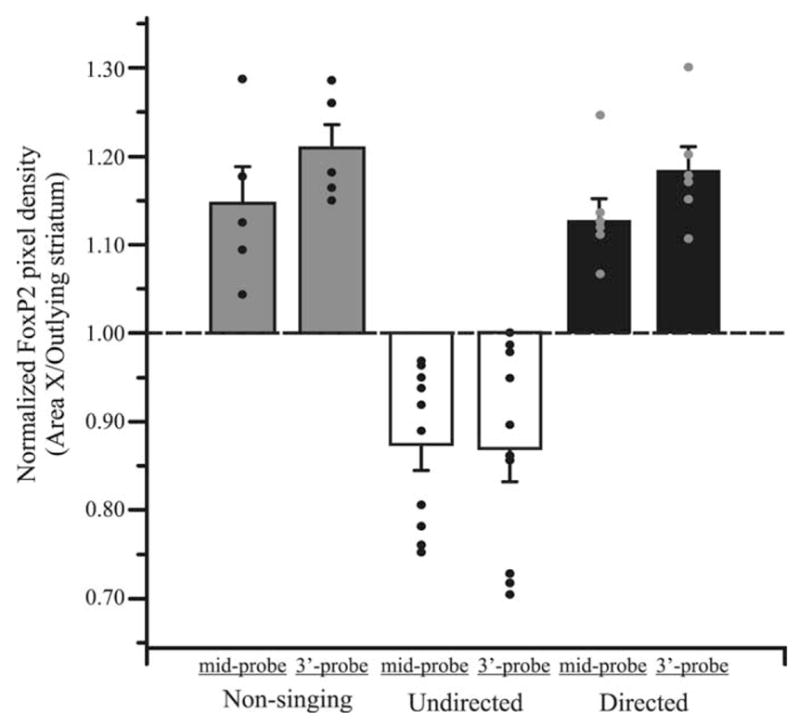
Undirected singing acutely downregulates FoxP2 in area X. Bar graphs show group and individual values of FoxP2 expression in area X relative to surrounding StM (mean ± SEM). Levels in undirected singers (white) are lower than in nonsingers (gray) or directed singers (black) (mid-probe, p = 0.0006; 3′-probe, p = 0.0005). Nonsinging data are the same as shown in Figure 1.