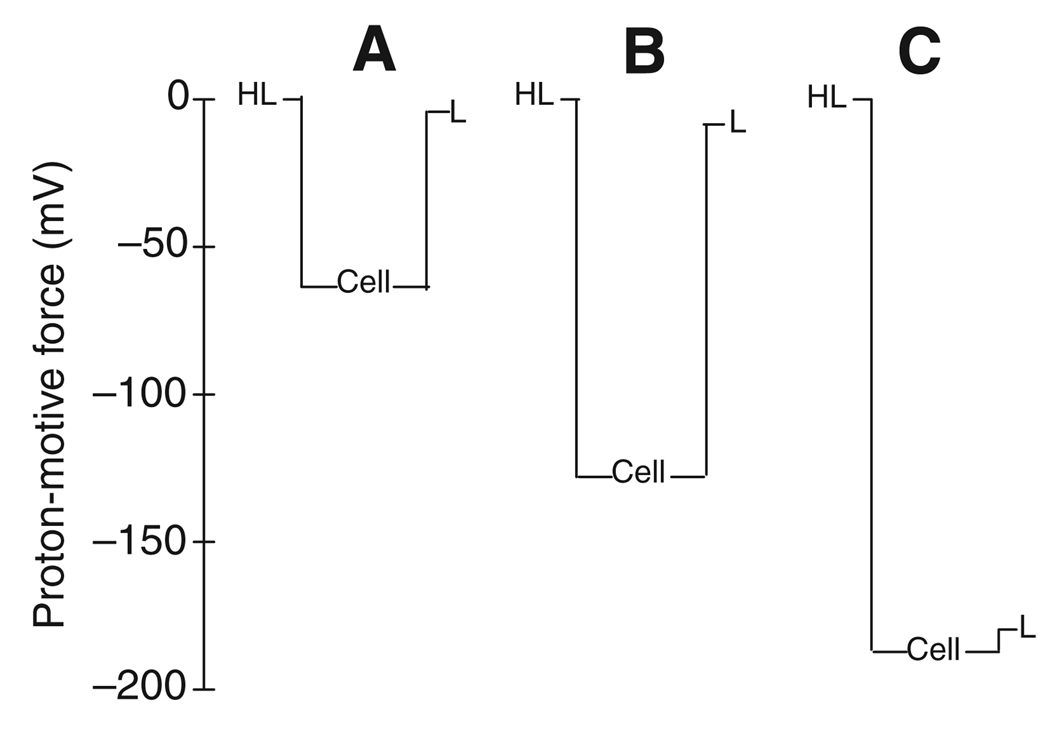
Fig. 1.
Transepithelial profiles of the proton-motive force (in mV) calculated from the average membrane voltages and transmembrane pH gradients for (A) a control condition with mosquito saline of pH 7 on both sides of the tissue, (B) after stimulation with serotonin (pH=7 on both sides; lumen 100mmoll−1 NaCl) and (C) after increasing the pH of the luminal perfusate to 10. HL, hemolymph; L, lumen.

