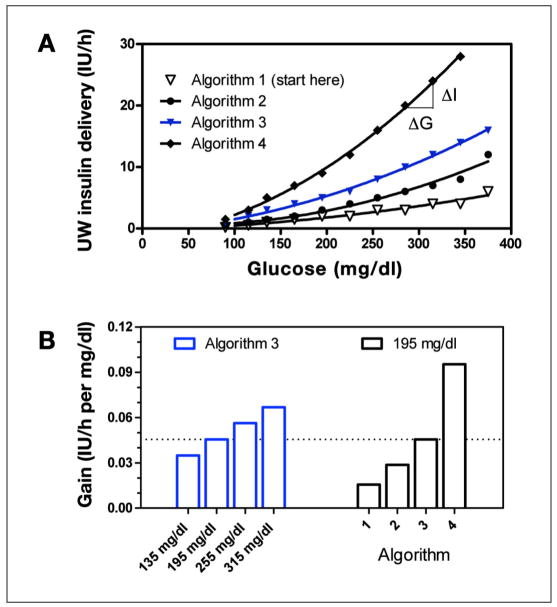
Figure 2.
(A) Graphical representation of the different sliding scales used in the UW protocol. Solid curves indicate polynomial fits. (B) Algorithm gain (ΔI/ΔG) as glucose increases from 135 to 315 mg/dl along the Algorithm 3 curve (left bars, blue) and as glucose remains fixed at 195 mg/dl, but the curve changes from Algorithm 1 to Algorithm 4 (right bars).

