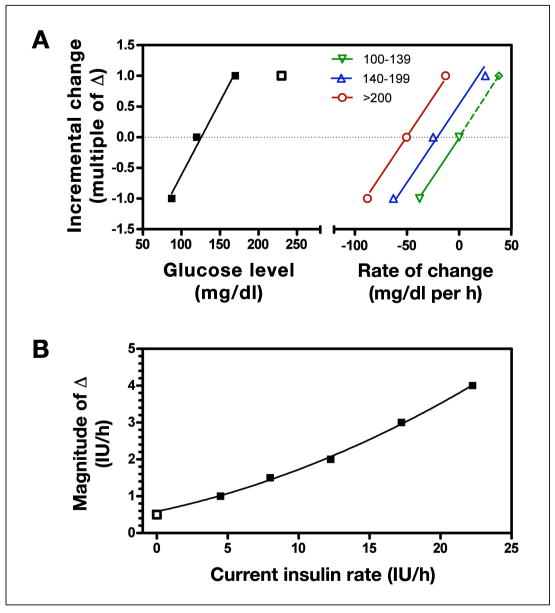
Figure 4.
(A) Incremental changes in insulin for the Y protocol (data to left of split axis). Solid line indicates that the change is approximately proportional to glucose for values up to ~150 mg/dl, but values higher than 150 mg/dl (open squares) produces the same incremental change (1Δ). Curves to the right of the split axis show adjustments made based on the rate of change of glucose (0.025Δ per mg/dl per h, with slope common to all glucose ranges). (B) Change in magnitude of the increment (Δ) based on current insulin delivery rate (symbols) with corresponding quadratic polynomial fit (solid curve).

