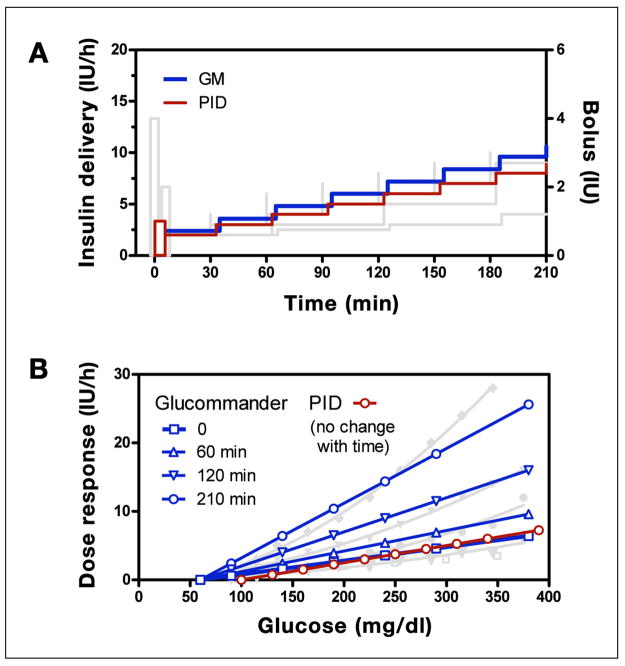
Figure 6.
(A) GM (blue) and PID (red) algorithm responses for a subject initiating therapy at 180 mg/dl with no subsequent change in glucose superimposed with curves for the written instruction algorithms shown in Figure 5 (shaded curves). (B) Glucommander glucose response curves superimposed with similar curves for the UW algorithm shown in Figure 2 together with PID curve.

