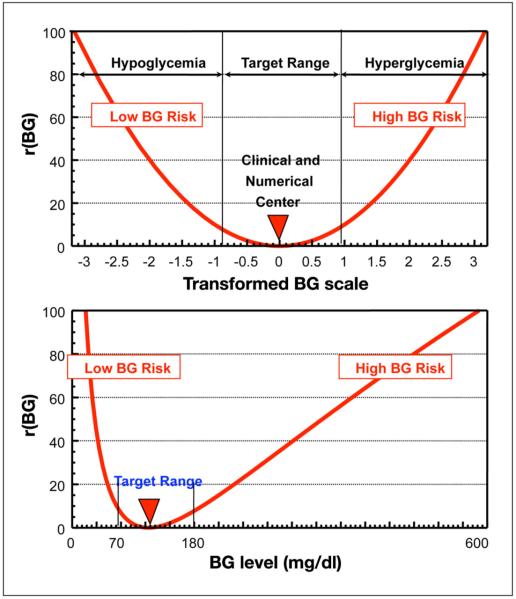
Figure 2.
The upper panel presents the risk function used to define the LBGI and the HBGI as derived from the distribution of the transformed BG levels shown in Figure 1 (lower panel). The lower panel shows this risk function brought back into the original glucose scale. It is evident that the risk values associated with progressive hypoglycemia increase much faster than the risk values associated with progressive hyperglycemia.

