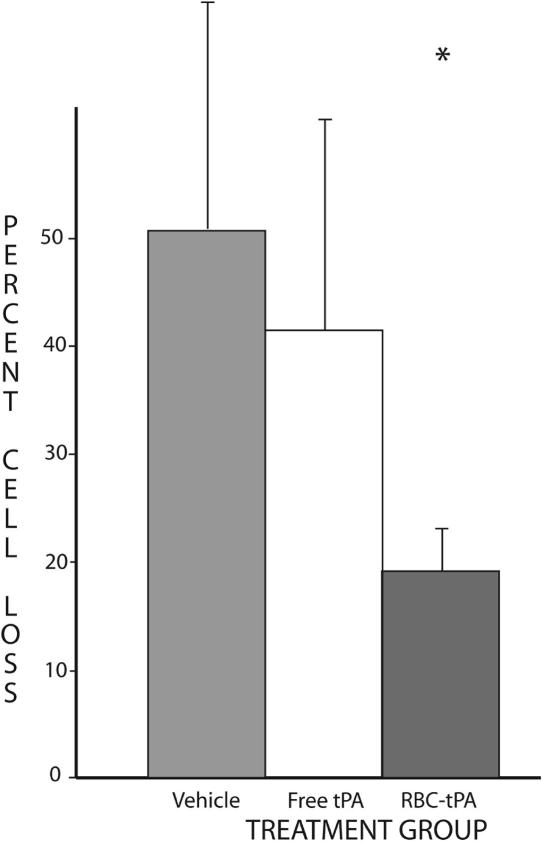
Fig. 6.
Percent hippocampal cell loss. Cell counts in defined areas of CA3 were compared on the injured (left) and uninjured (right) side of each slice studied (see text). The mean percent loss for each of the three treatment groups is shown. The vertical bars represent standard deviations. Cell loss is significantly lower in the RBC-bound tPA group (*).
tPA: tissue plasminogen activator

