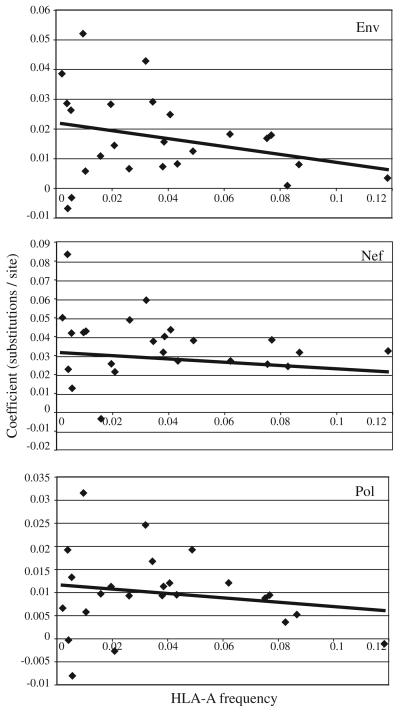
FIG. 1.
The HLA-A allele frequency is plotted along the x-axis and the linear regression coefficient along the y-axis. The coefficient can be interpreted as the change in terminal branch length (corrected substitutions per site) in the presence compared to the absence of each given allele. The line represents the linear regression line (p-value=n.s. for all) and is included for clarity.

