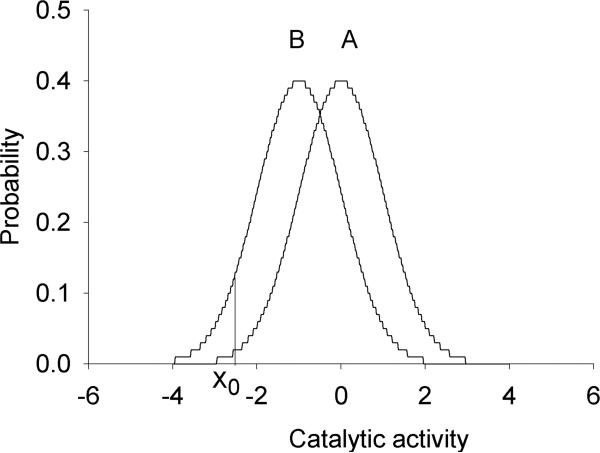
FIG. 2.
Example of a genotype–phenotype association for a multifactorial phenotype. As a phenotype, standardized normal distributions of catalytic activity of a hypothetical metabolic pathway (subject to multifactorial regulation) are presented (Population A: fast metabolism; Population B: slow metabolism). Xo reflects the threshold activity below which drug or food toxicity is observed. Note that an overlapping phenotypic distribution is a mainstay occurrence in association of a multifactorial phenotype with an omics marker. Reprinted by permission from Bentham Science Publishers: [Ozdemir et al., Curr Pharmacogenomics Person Med 2005; 3, 53−71].

