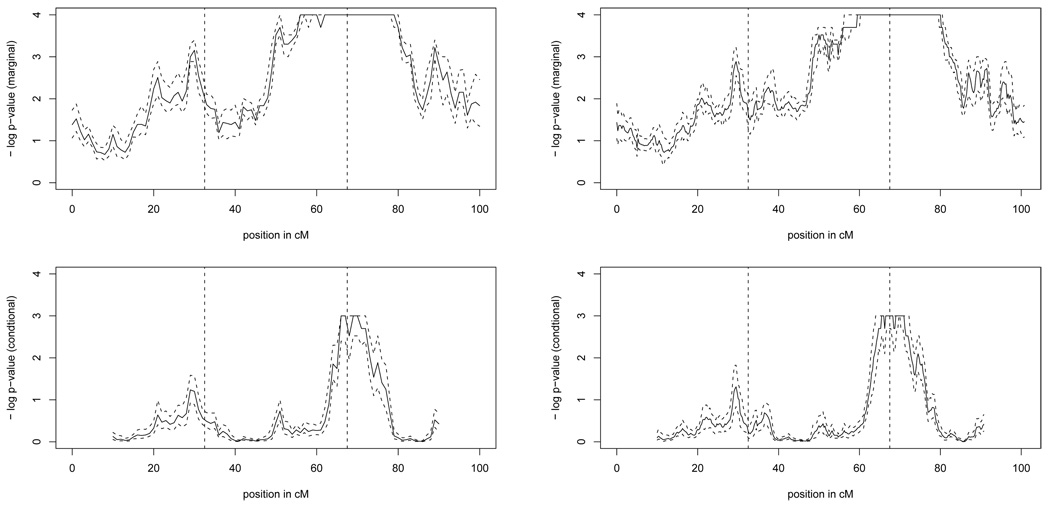
Figure 7.
10-th, 50-th, and 90-th percentiles of the negative log randomized p-values for the marginal and conditional tests. The top two plots are for the marginal tests, the bottom two plots are for the conditional tests. For results on the left, the marker data used to infer the distribution of the inheritance vectors are SNP blocks that are 1 cM apart and have 3 SNPs per block with recombination rates 10−6 between adjacent SNPs in a block. On the right, the marker data used are evenly spaced SNPs that are 0.25 cM apart.

