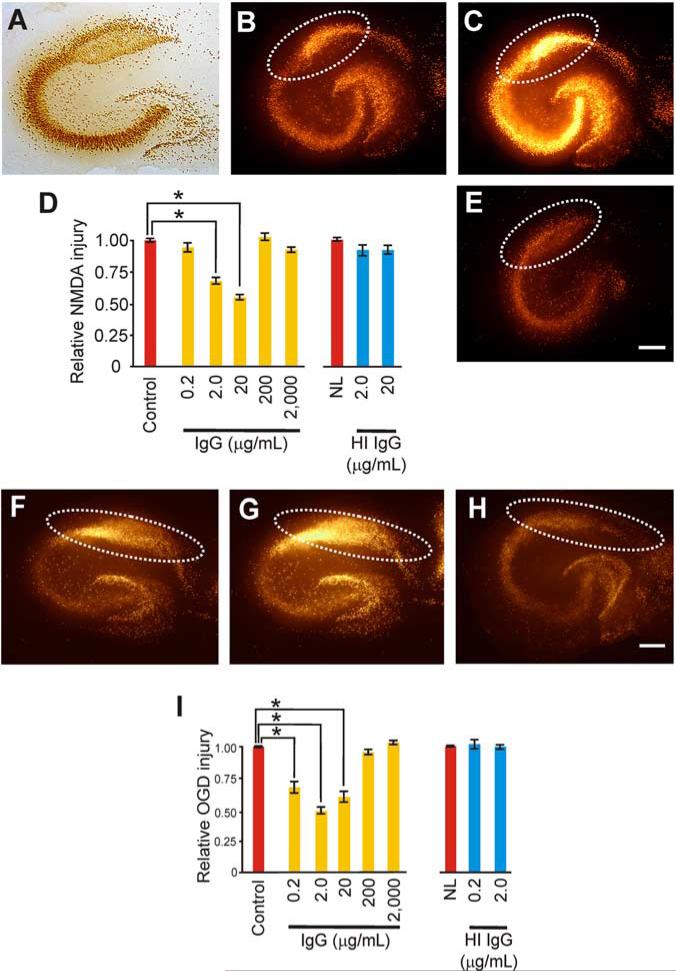
Figure 1.
IgG-triggered neuroprotection against excitotoxic injury showed a U-shaped response in slice cultures. A, Immunostaining with NeuN shows the principal neuron cytoarchitecture for the pyramidal and dentate gyrusareas. B–D, Excitotoxic injury from NMDA was measured via Sytox, a fluorescent dead cell marker, quantified in the CA1 area (dotted white lines), and expressed as a ratio of injury (B) over maximal injury (C) made relative to control cultures (D). E, Exposure to nonspecific, monomeric IgG for 3 d evoked significant ( p < 0.001; α = 1.00) reductions ininjury at 2.0 and 20 (shown) μg/ml [with relative injury levels of 0.89±0.06 (n = 13), 0.67±0.04 (n = 13), 0.55±0.05 (n = 13), 1.04±0.06 (n = 21) and 0.92±0.04 (n = 20) vs control (1.00+0.03; n = 28)]. Heat-inactivated (HI) IgG (2.0 and 20μg/ml) had no protective effect against NMDA [with p equalto 0.58 (differences in means)a nd relative injury levels of 0.92±0.07 (n = 11) and 0.92±0.07 (n = 27) vs control (1.00±0.03; n = 21)]. Similarly, monomeric IgG-triggered neuroprotection against OGD-induced excitotoxic injury showed a similar U-shaped response in slice cultures. F, G, I, Excitotoxic injury from OGD exposure was measured and quantified as above in the CA1 area (dotted white lines) and expressed as a ratio of injury (F) over maximal injury (G) made relative to control cultures (I). H, I, Exposure to nonspecific, monomeric IgG for 3 d (H) evoked significant ( p < 0.001; α = 1.00) reductions in injuryat 0.2, 2.0 (shown) and 20 (I) μg/ml but not 200 and 2000 μg/ml [with relative injury levels of 0.68±0.09 (n = 8), 0.49±0.05 (n = 11), 0.0.59±0.08 (n = 10), 0.95±0.05 (n=6), and 1.02±0.04 (n = 6) vs control (1.00±0.02; n = 11)]. HIIgG (0.2 and 2.0 μg/ml) had no protective effect agains tO GD [with p = 1.00 (differences in means) with relative injury levels of 1.03±0.06 (n = 15), 1.00 ± 0.04 (n = 15) vs control (1.00 ± 0.06; n = 6)]. Scale bars, 250μm. Data represent mean ± SEM and significance (*p < 0.05).

