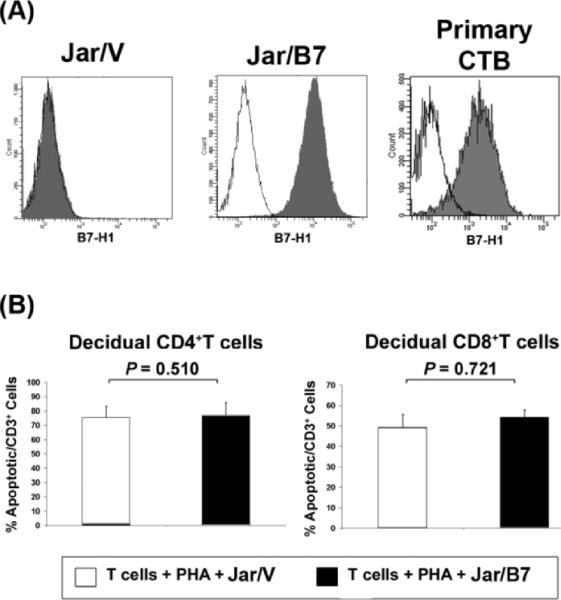
FIG. 5.
A) Representative histograms from flow cytometric analysis of B7-H1 expression in control (Jar/V) or CD274-transfected (Jar/B7) cells and primary chorionic trohpoblast cells (Primary CTB). B) Analysis of CD274 effects on decidual T cell apoptosis. Graphs represent mean percentages of apoptotic T cells from six different patients. Error bars indicate SEM. PHA, phytohemagglutinin.

