
Table 3.
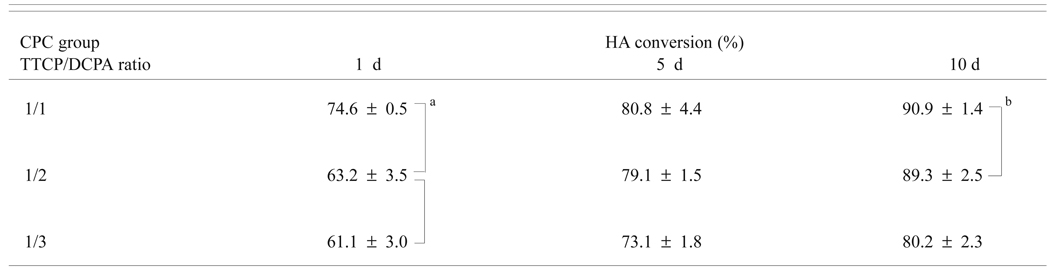
| Table 3a. HA conversions of CPC groups with different TTCP/DCPA molar ratios as a function of immersion time in PLS |
|---|
 |
| Table 3b. Two-way ANOVA results, main effects and interactions on HA conversion | |
|---|---|
| Source | Significance, p value |
| Days of immersion | < 0.001 |
| CPC group | < 0.001 |
| Interaction | 0.018 |
a
Mean ± standard deviation (n = 3)
b
Groups connected by a vertical or horizontal line are not significantly different (p > 0.05)