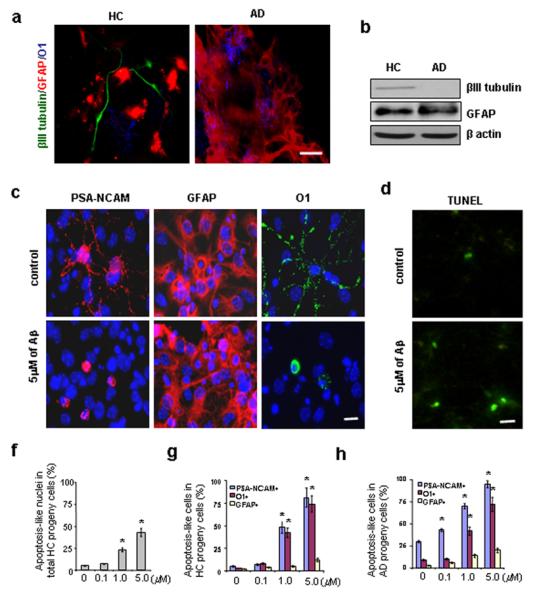
Figure 2.

Cell fate decisions of AD and HC GPCs and the apoptotic effect of Aβ treatment on newly generated cells. Second passage GPCs from AD and HC subjects (n = 3 per group) were cultured in either Aβ-treated or non-treated differentiation medium for 2 days followed by another 5 days in Aβ-free differentiation medium. (a). The cell fate decisions of non-treated AD and HC GPC progeny were visualized by immunostaining the astrocytes (red) with an anti-GFAP antibody, the oligodendrocytes (blue) with an anti-O1 antibody, and the mature neurons (green) with an anti-βIII tubulin antibody. There were fewer neurons (green) among the AD GPC progeny than among the HC progeny. (b). A representative Western blot demonstrated reduced βIII tubulin levels in the AD progeny compared to the HC progeny (both non-treated), while no significant differences in GFAP expression were observed. (c). Differentiated progeny from HC GPCs treated with 5 μM Aβ1-42 were visualized by immunostaining for PSA-NCAM (a neuroblast marker), GFAP (an astrocyte marker), O1 (an oligodendrocyte marker), and DAPI (a cell nucleus marker). (d). A representative micrograph with TUNEL staining showed an increased number of apoptotic cells in progeny from Aβ-treated vs. non-treated HC GPCs. (e). Quantification of immunoreactive structures revealed a significant increase in the number of apoptotic nuclei among the progeny of HC GPCs treated with ≥ 1 μM Aβ compared to their non-treated counterparts (n = 3 for each group, ANOVA, *p < 0.01). (f). Quantification also revealed an increase in the number of apoptosis-like PSA-NCAM+ and O1+ cells among the progeny of HC GPCs exposed to ≥ 1μM Aβ (n = 3 per group, ANOVA, *p < 0.01). (g). Nearly all of the PSA-NCAM+ cells and most of the O1+ cells were apoptosis-like in the AD GPC progeny treated with 5 μM Aβ (n = 3 per group, ANOVA, *p < 0.01). Experiments were repeated 3 times per condition. Scale bars: 25 μm (a), 10 μm (c) and (d).
