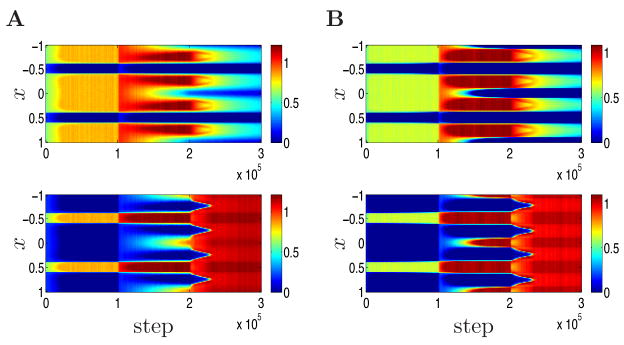
Figure 5.
Development of OD columns under the homeostatic plasticity rule. Panels plot synaptic strengths in color as a function of cortical position, x, and simulated steps as in Fig. 2A or Fig. 4A. Parameters are from parameter set 2 except where other values are explicitly noted. The homeostatic plasticity rule is more robust to parameter choices: the two eyes equalize after the maturation of inhibition with weak intracortical interactions (A) MA = 0.5, or with relatively weak inhibition (B) R = 0.8.

