
Figure 4.
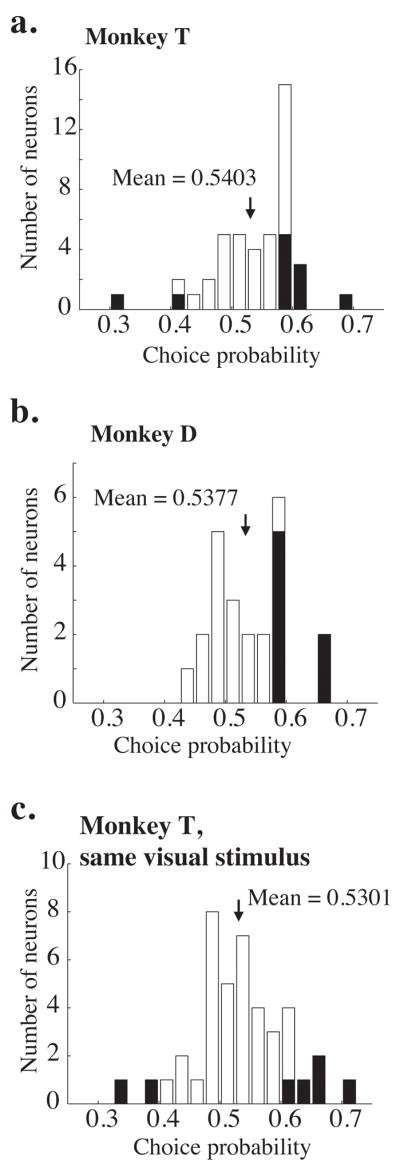
Frequency distributions of measured choice probabilities. a. Choice probabilities measured on 0% coherence trials for 44 neurons in monkey T; a different random number seed was used on each trial. The shaded bars indicate experiments for which the choice probability was significantly different from 0.5 (p<0.05, bootstrap test described in Methods). The black arrow indicates the mean of the distribution. The mean is significantly greater than 0.5 (t-test, p<0.05). b. Same, for 30 neurons in Monkey D. Again, the mean is significantly greater than 0.5 (t-test, p<0.05). c. Same, for 41 neurons in monkey T, but using the same random number seed for every trial in a given experiment. The mean remains significantly greater than 0.5 (p<0.05).