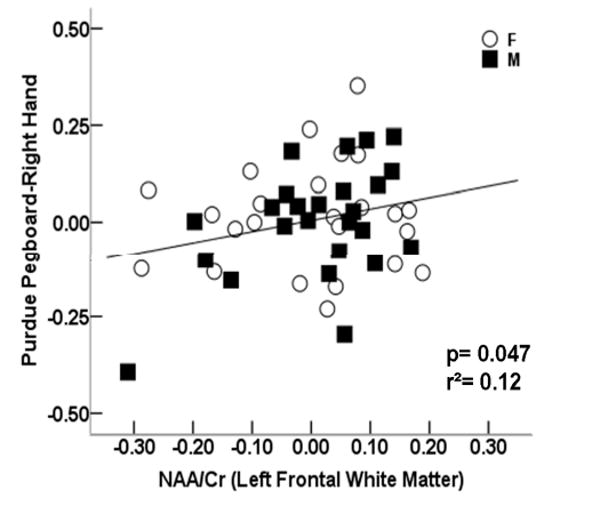
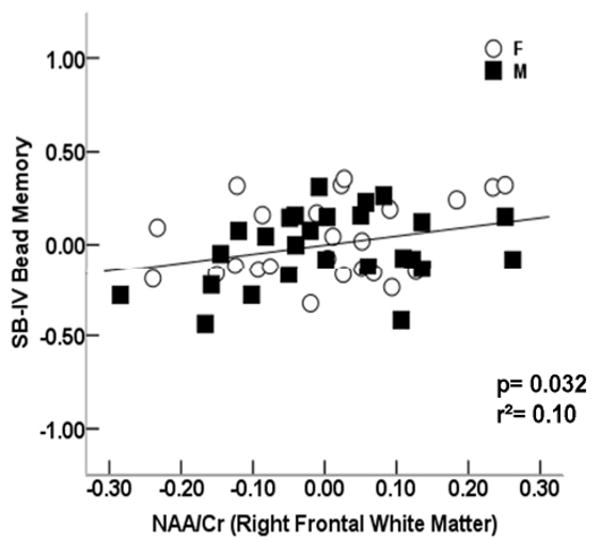
FIGURE 2.


Scatter plots showing the relationship between the NAA/Cr ratio in the left frontal white matter and A) scores of Purdue Pegboard Right Hand (slope=0.611 year-1; p=0.047), and between the NAA/Cr ratio in the right frontal white matter and B) SB IV-Bead Memory (slope=0.494 year-1, p=0.032). Residuals of the test scores and NAA/Cr after regressing on age are plotted.
