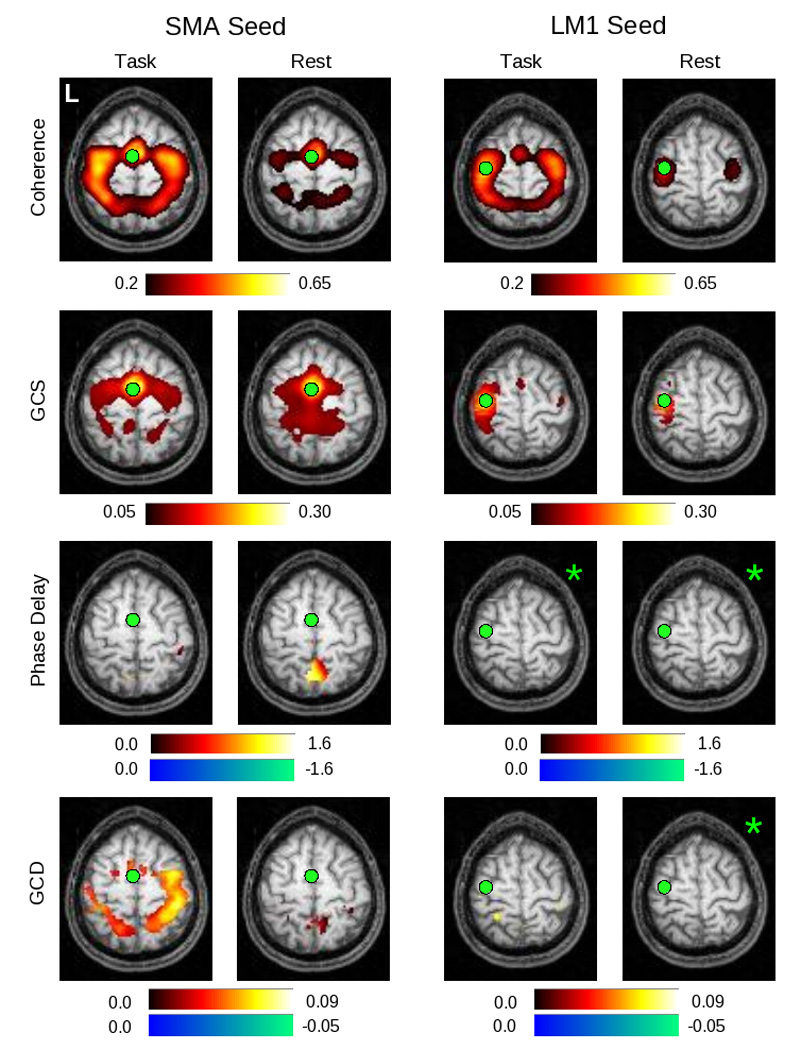
Figure 7.

In this figure can be seen group maps thresholded at p < 0.05 (corrected) across all 14 subjects, for the range of values demonstrated by the associated color bars, for each of the analysis methods. The left two columns represent values produced for the SMA seed in both the task and rest conditions; the right two columns represent values obtained for the LM1 seed in both the task and rest conditions. Note that the slice is not identical for the two seeds (Z = 60 for the SMA seed, Z = 66 for the LM1 seed). Those images marked by a green asterisk (*) contained no voxels significant at p < 0.05, corrected.
