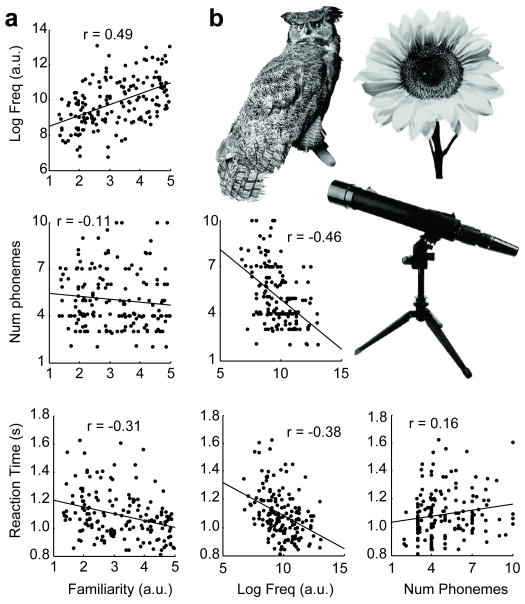
Figure 2.
Picture stimuli. (a) Pairwise correlations between the four variables of interest: concept familiarity, word frequency, word length and reaction time. Best-fit regression lines and correlation coefficients are shown. All correlations were significant except for that between familiarity and length. (b) Examples of the pictures. In the actual experiment, the pictures were presented in full color.

