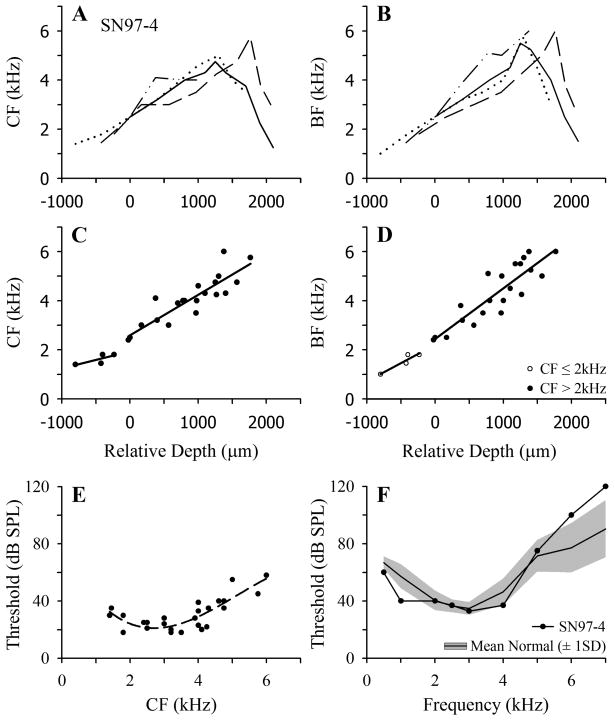
Fig. 1.
Frequency mapping data for an individual normal starling (SN97-4). A and B. Characteristic frequency (CF) and best frequency (BF), respectively, as a function of recording depth in multiple penetrations through the FLC. Data for four penetrations are indicated by different lines. Relative depth is normalized to that at which the CF closest to 2.5 kHz was encountered. C and D. CF and BF data, respectively, from all points in the four penetrations, up to that at which the frequency reversal occurred in each penetration. Solid lines are linear regression functions fitted to points with CF ≤ 2 kHz and CF > 2 kHz (see text). E. Threshold at CF as a function of CF for multi-unit clusters in starling SN97-4; solid line is fitted polynomial function. F. ABER audiogram for starling SN97-4 (filled circles); the solid black line shows the mean normal starling ABER audiogram based on a large sample (N = 10) of normal starlings, and the shaded region shows ± 1 standard deviation (SD) range around the mean.

