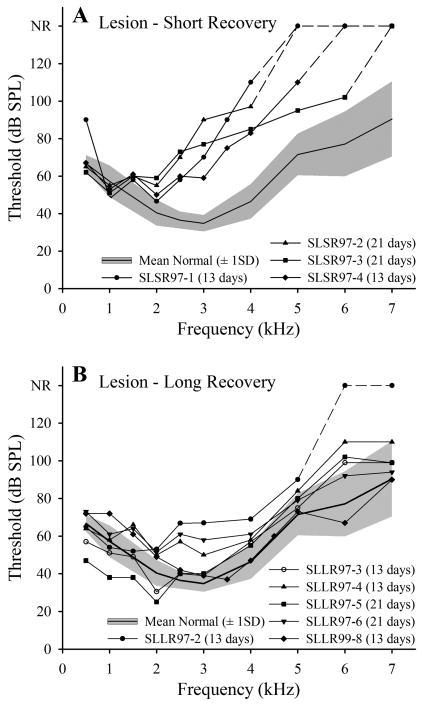
Fig. 3.
Hearing losses in lesioned starlings. A and B. ABER audiograms for individual starlings in the lesion – short recovery (SLSR) and lesion – long recovery (SLLR) groups, respectively, plotted relative to mean normal threshold ± 1SD (shaded region). NR: no response; dashed portions of lines therefore denote frequency regions at which thresholds were higher than the maximum SPLs produced by our equipment (in all cases over 110 dB). Duration of injection regime is indicated for each starling. Recordings were made two days after last injection of kanamycin, immediately prior to recordings from the FLC.

