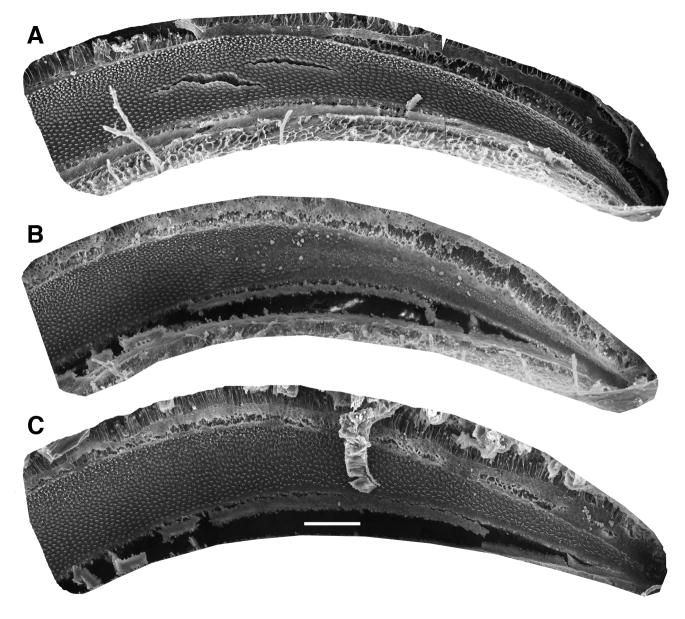
Fig 4.
Low-power scanning electron micrographs showing basilar papilla (BP) in representative normal, lesion – short recovery, and lesion – long recovery starlings. Each panel shows a low power scanning electron microscope image of the basal half of the BP. Scale bar (shown in A): 100 μm. A. Normal BP (from the work of Marean et al. (1993). B. BP from lesion – short recovery starling SLSR97-1, for which data are presented in Figs. 3A and 6. C: BP from lesion – long recovery starling SLLR97-5, for which data are presented in Figs. 3B and 8; note that the density of hair cells in the basal papilla appears normal, but the mosaic is abnormal.

