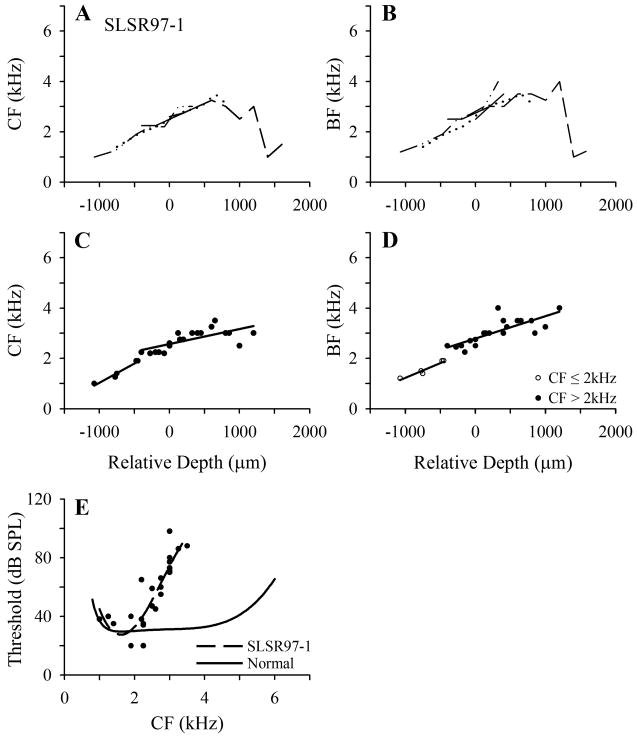
Fig. 6.
Frequency mapping data for an individual starling (SLSR97-1) in the lesion – short recovery (SLSR) group. A and B. Tonotopicity data for individual penetrations (details as in Figs. 1A and B). C and D. Pooled data from all points up to frequency reversals in the penetrations shown in A and B. As explained in the text, separate linear regression lines have been fitted for points with CF above and below 2 kHz. In D, these points are distinguished by different symbols, because CF and BF might not fall within the same frequency ranges, although in this case all points with CF in one frequency range had BF in the same range. E. Threshold as a function of CF for all recording sites plotted in C; broken line is polynomial fitted to these data; solid black line is polynomial fitted to normal threshold data (from Fig. 2C).

